Build your own Raspberry Pi weather station with weather forecast and ESP32 wireless sensors
For years now, one of these typical weather stations has been sitting in my living room. It works as it should, but it lacks a second or even third radio sensor, and a weather forecast would be a great addition. That's why I started building my own weather station a few weeks ago, one that could cover all my wishes if possible. In the meantime, the weather station is running stable, so I would like to give you a description of how my project is built. All components are available on GitHub and linked at the corresponding sections.
What should the weather station be capable of? After some brainstorming this list came out:
- Raspberry Pi with display as base station.
- Battery-powered sensors that are charged via solar cells.
- The number of wireless sensors can be adjusted to your own wishes.
- The sensors can measure temperature, humidity and air pressure.
- The weather forecast is to be loaded via a free API and automatically updated on a regular basis.
- Clear presentation of the data (although "clear" is of course very subjective).
- Only standard components, so that the setup is reproducible.
- Worldwide usable, so in my case no special weather data from Austria, although they would probably be much more accurate.
- Professional look. The whole weather station should look like a real product.
I don't think the list holds any particular surprises. Especially the last point is very important to me. It wouldn't be the first project that never gets beyond prototype status.
The building instructions are divided into the following points:
- The basic setup of the weather station
- Setting up the Raspberry Pi
- OpenWeather API account setup
- MQTT broker installation
- Weather station application
- ESP32 sensor module
- Possible enhancements
The basic structure of the weather station
The following diagram shows the main components of the weather station:
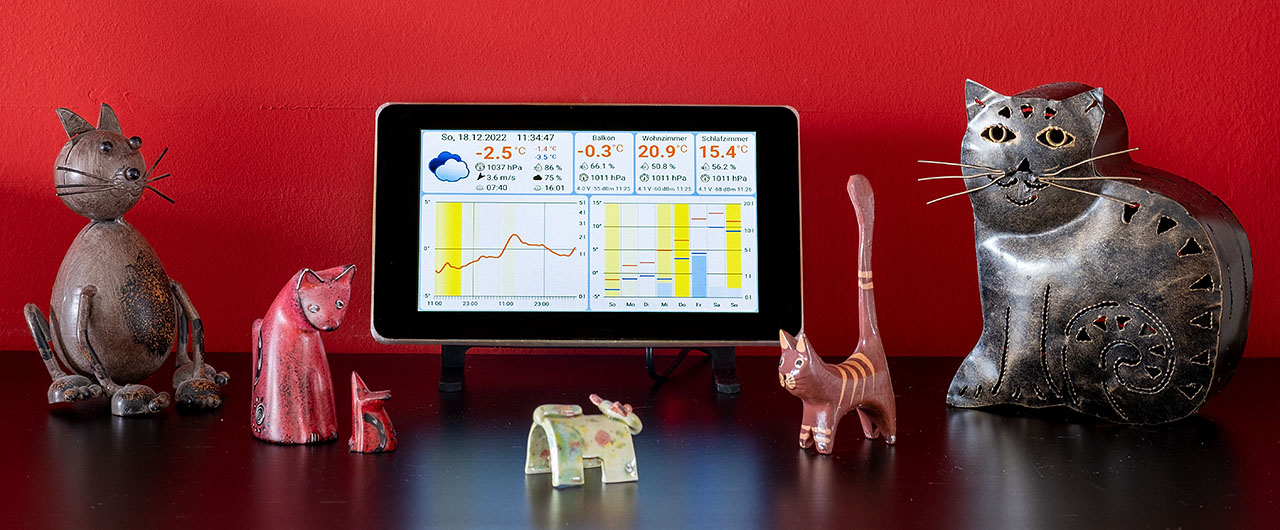
The actual base station consists of a Raspberry Pi with a 7 inch display and is responsible for loading the weather data and displaying the weather and sensor data. Fortunately, I still had a Raspberry Pi 3 A+ lying around, which is completely sufficient for this task. Unfortunately, it is hardly available in stores anymore and an expensive Raspberry Pi 4 would be completely oversized here. The sensor modules measure temperature, humidity and air pressure. I use the ESP32 for this, as I know this microcontroller quite well by now and its excellent deep-sleep mode makes it ideal for this task. The sensors do not communicate directly with the base station, but via an MQTT broker that also runs on the Raspberry Pi. The weather data is retrieved via a REST interface that provides data in JSON format, which is then processed by the application. After some research, I decided to use OpenWeather's API, as it covers everything I need and is also free up to a certain level of usage.
Setting up the Raspberry Pi
As mentioned above, I am using a Raspberry Pi 3 A+ for this. It is still my favourite of all the Raspberry Pi models. In principle, however, this should also work with a newer Raspberry Pi 4. The display is the official Raspberry Pi Touch Display. I won't explain the assembly here, I think there are enough instructions on the net. Additionally you need a microSD card (8GB or bigger) and of course a power supply.
Installing the Raspberry Pi OS
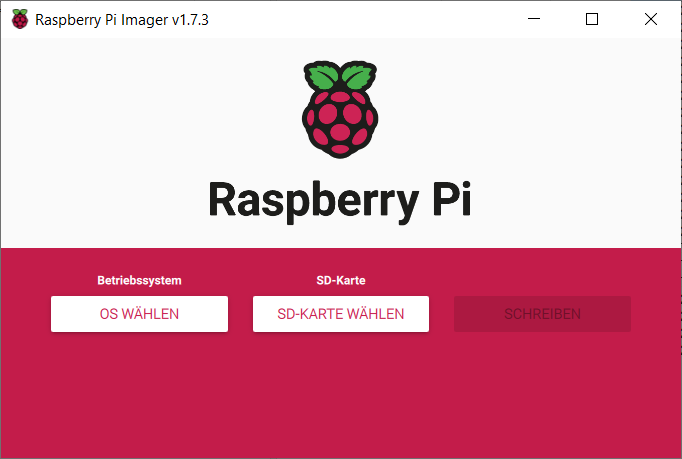
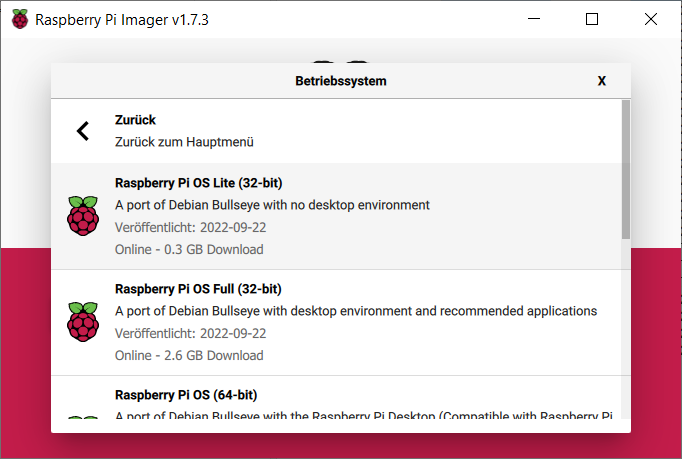
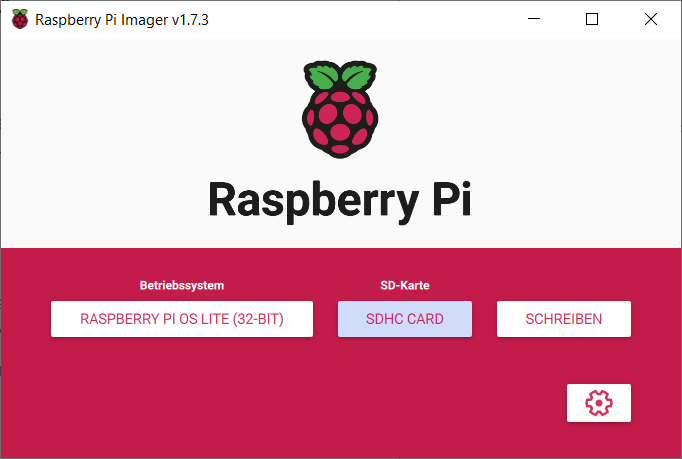
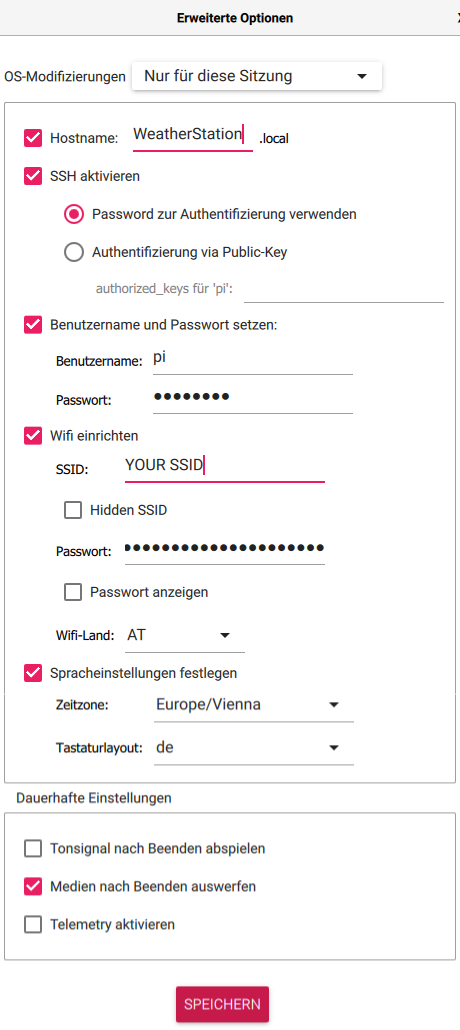
The first step is to install the operating system of the Raspberry Pi. Since the weather station is implemented in Python and Kivy, the 32-bit version of the Raspberry Pi OS Lite is sufficient. The current version is Debian "Bullseye". The easiest way to install it is with the Raspberry Pi Imager. In the meantime, you can also configure the WLAN access and the user with it. SSH access must also be activated. The following screenshots show the process:
After that, the SD card can be inserted into the Raspberry Pi and the computer can be booted. After the boot process, you can check on the router whether the Raspberry has started correctly and which IP address it has. It appears in the list of connections under the name that was specified in the setup. I recommend assigning a fixed IP address to the Raspberry Pi, as this address is required by the sensor modules.
Now you can log in (most easily with PuTTY) via SSH on the Raspberry with the configured user. It is recommended to first update the system with the commands
sudo apt-get update
sudo apt-get upgrade
sudo reboot
to bring the system up to date. This can take a few minutes. After rebooting, you now have an up-to-date Raspberry Pi OS installation.
Install Kivy Framework
As with the water drops, I use the Kivy Framework for this application. It does not need the Linux desktop, but you still need some additional libraries. These are installed with the following commands:
sudo apt-get install libsdl2-dev libsdl2-image-dev libsdl2-mixer-dev libsdl2-ttf-dev
sudo apt-get install libmtdev1
sudo apt install python3-pip
pip3 install kivy[base]
In order for the touch display to be supported, the Kivy configuration must be adapted. To do this, edit the file ~/.kivy/config.ini with the command:
nano ~/.kivy/config.ini
and changes the [input] area as follows:
mouse = mouse
mtdev_%(name)s = probesysfs,provider=mtdev
hid_%(name)s = probesysfs,provider=hidinput
To adjust the resolution to the display, the height is adjusted in the [graphics] area:
height = 480
In addition, the mouse pointer is not needed. This line is adapted for this purpose:
show_cursor = 0
Finally, logging is turned off here to protect the SD card. This setting is located in the area [kivy]
log_enable = 0
Optimisations
The following are some changes to extend the durability of the SD card by reducing the write accesses. First, swapping is deactivated:
sudo service dphys-swapfile stop
sudo systemctl disable dphys-swapfile
sudo apt-get purge dphys-swapfile
An entry is then made in /boot/cmdline.txt. The editor is started with
sudo nano /boot/cmdline.txt
The option noswap is added to the end of the line. The whole line then looks like this:
console=serial0,115200 console=tty1 root=PARTUUID=dbc0c677-02 rootfstype=ext4 fsck.repair=yes rootwait noswap
To prevent log files from being permanently written to the SD card, temporary directories can be relocated to the working memory. To do this, the file /etc/fstab is modified with
sudo nano /etc/fstab
and it should look like this:
proc            /proc           proc    defaults          0       0
PARTUUID=dbc0c677-01  /boot           vfat    defaults,noatime  0       2
PARTUUID=dbc0c677-02  /               ext4    defaults,noatime  0       1

# Log to RAM
tmpfs   /tmp            tmpfs   defaults,noatime,nosuid,mode=1777,size=256m 0 0
tmpfs   /var/log        tmpfs   defaults,noatime,nosuid,mode=0755,size=128m 0 0
tmpfs   /var/tmp        tmpfs   defaults,noatime,nosuid,mode=0755,size=128m 0 0

# a swapfile is not a swap partition, no line here
#   use  dphys-swapfile swap[on|off]  for that
After a reboot, the adjustments can be checked with this command:
df -h
The result should look something like this:
pi@WeatherStation:~ $ df -h
Filesystem      Size  Used Avail Use% Mounted on
/dev/root        15G  1.9G   12G  14% /
devtmpfs         85M     0   85M   0% /dev
tmpfs           214M     0  214M   0% /dev/shm
tmpfs            86M  3.2M   83M   4% /run
tmpfs           5.0M  4.0K  5.0M   1% /run/lock
tmpfs           256M     0  256M   0% /tmp
tmpfs           128M  164K  128M   1% /var/log
tmpfs           128M     0  128M   0% /var/tmp
/dev/mmcblk0p1  255M   50M  206M  20% /boot
tmpfs            43M     0   43M   0% /run/user/1000
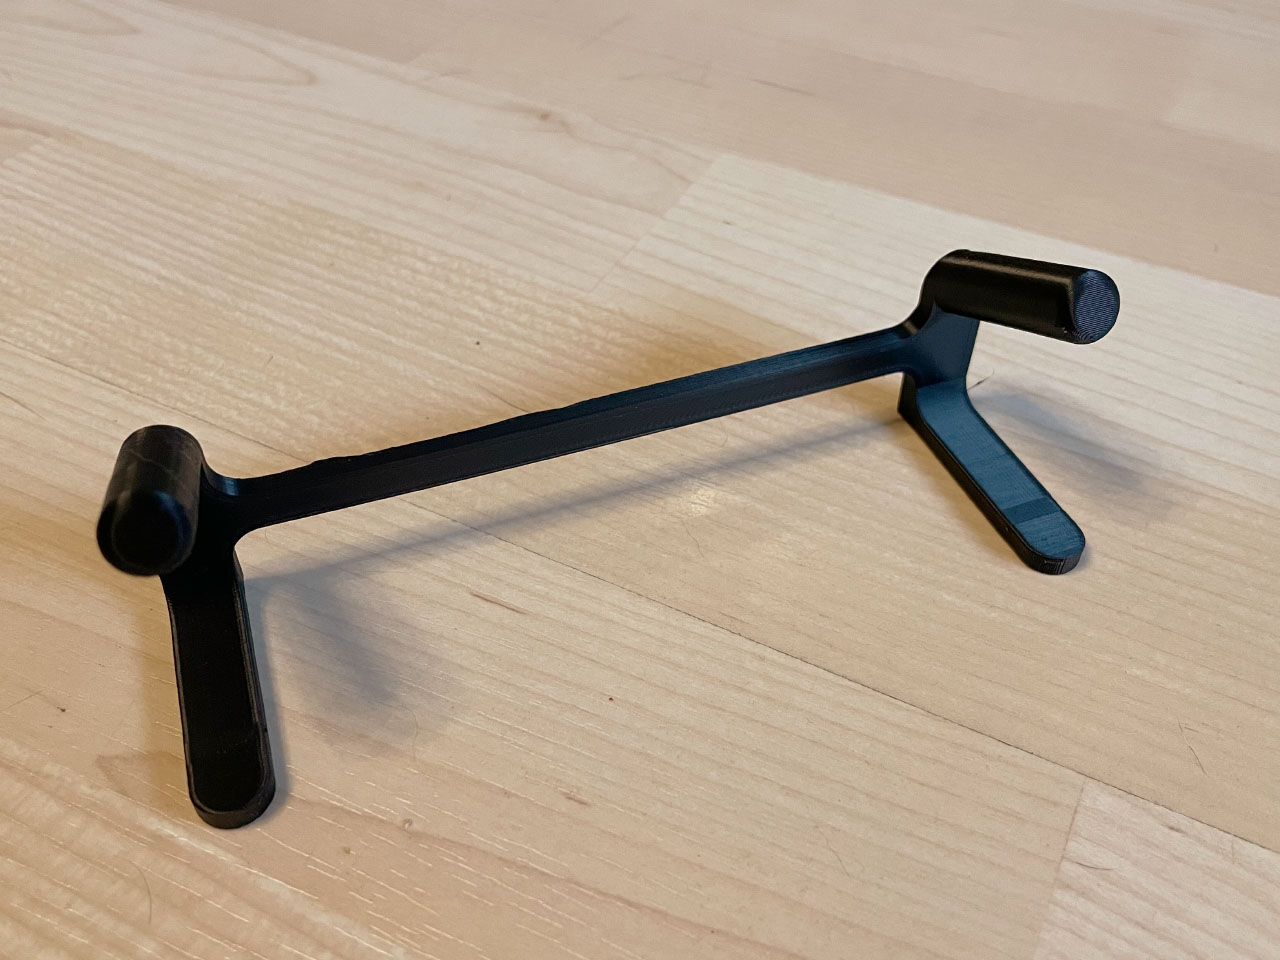
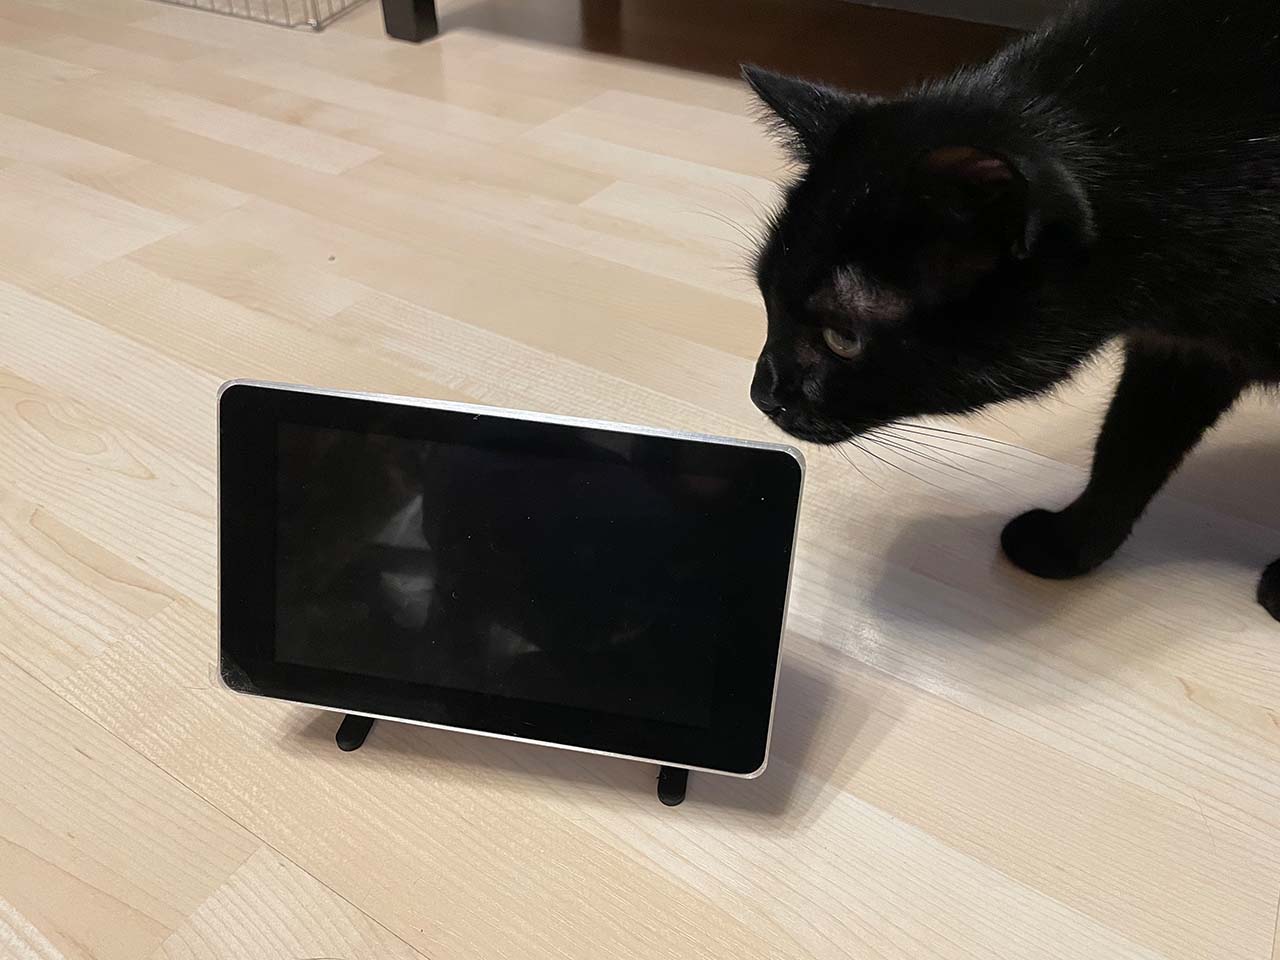
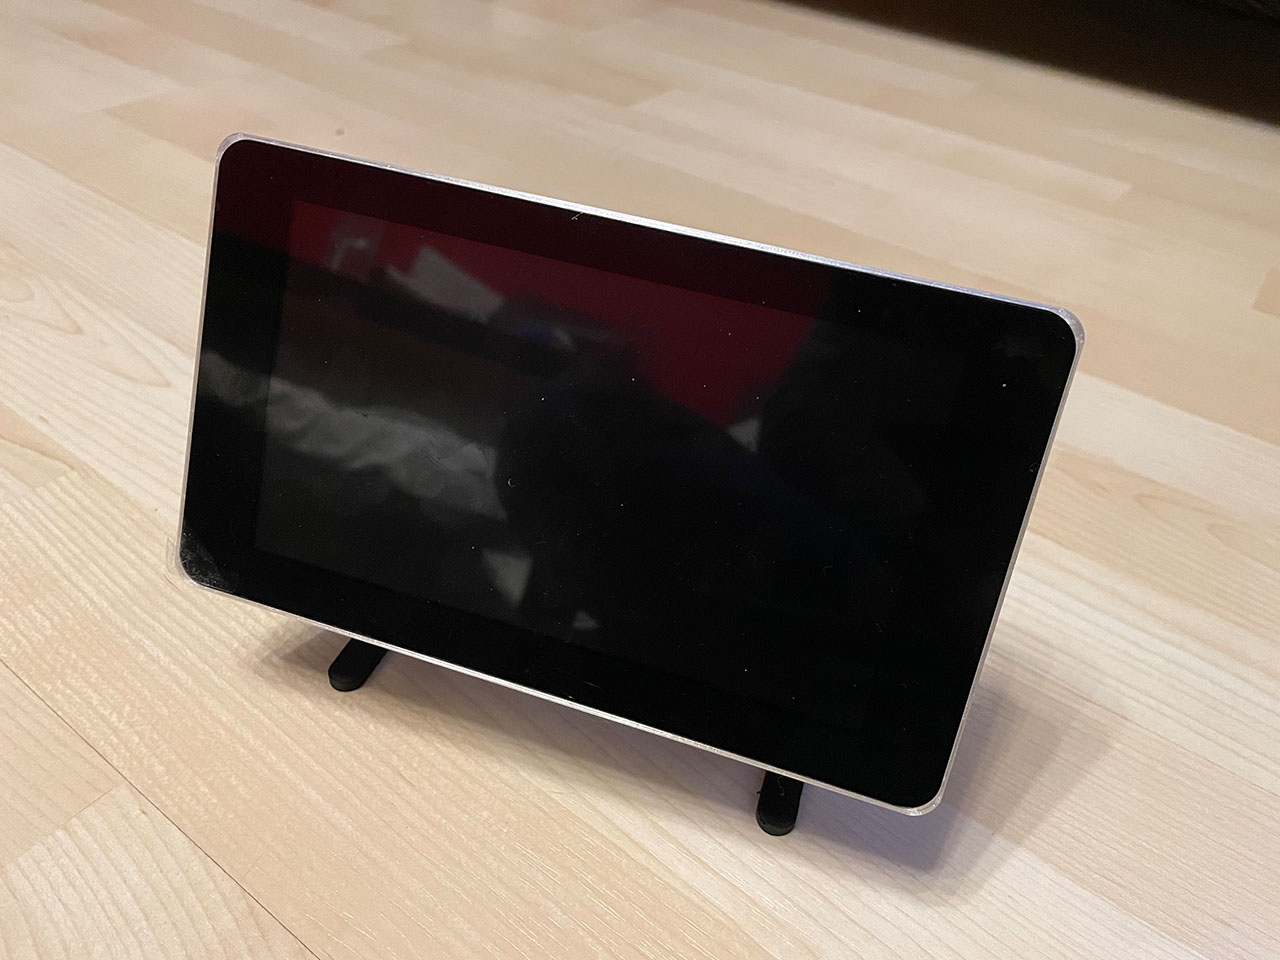
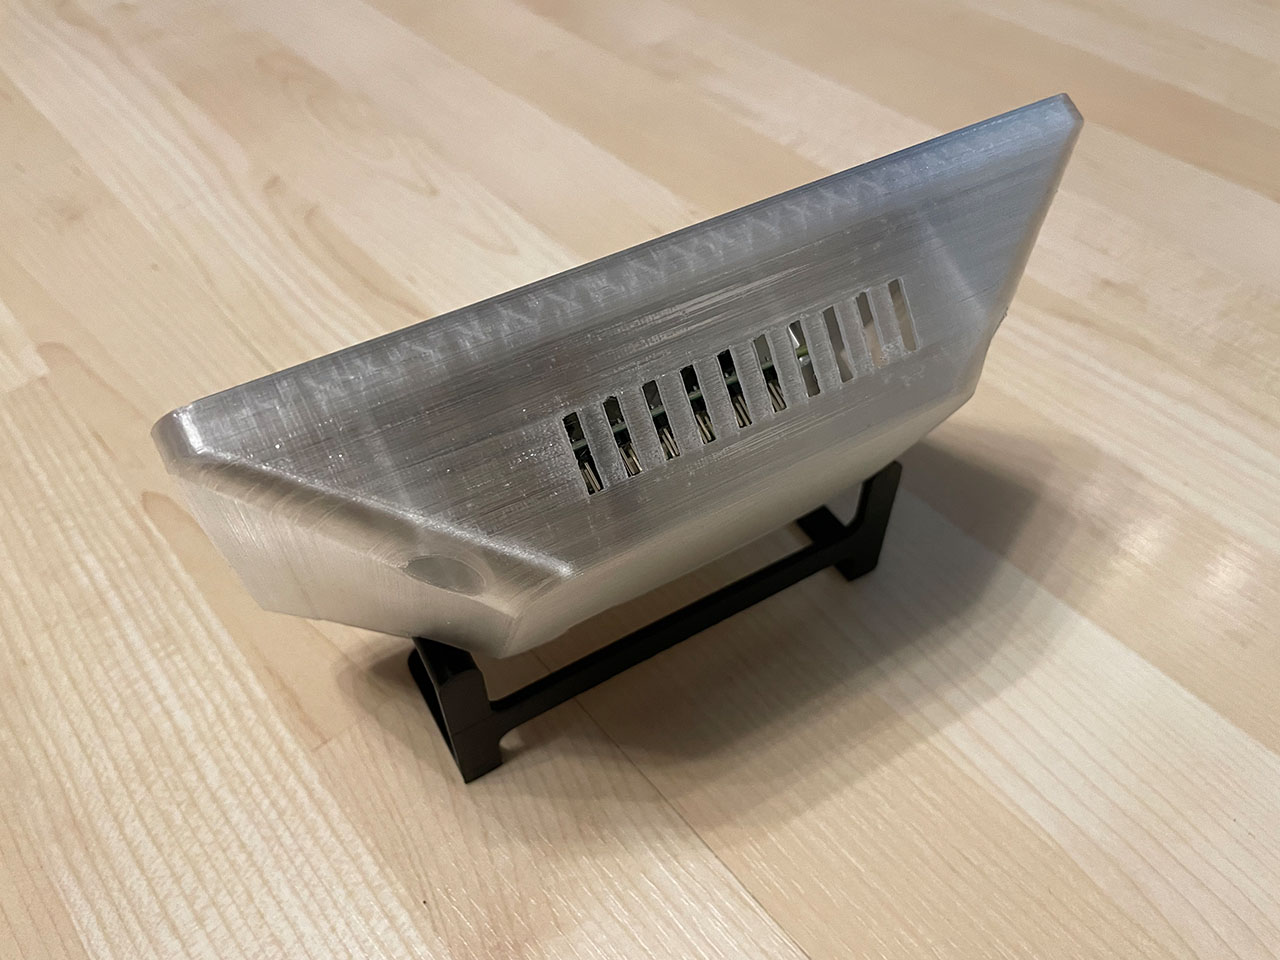
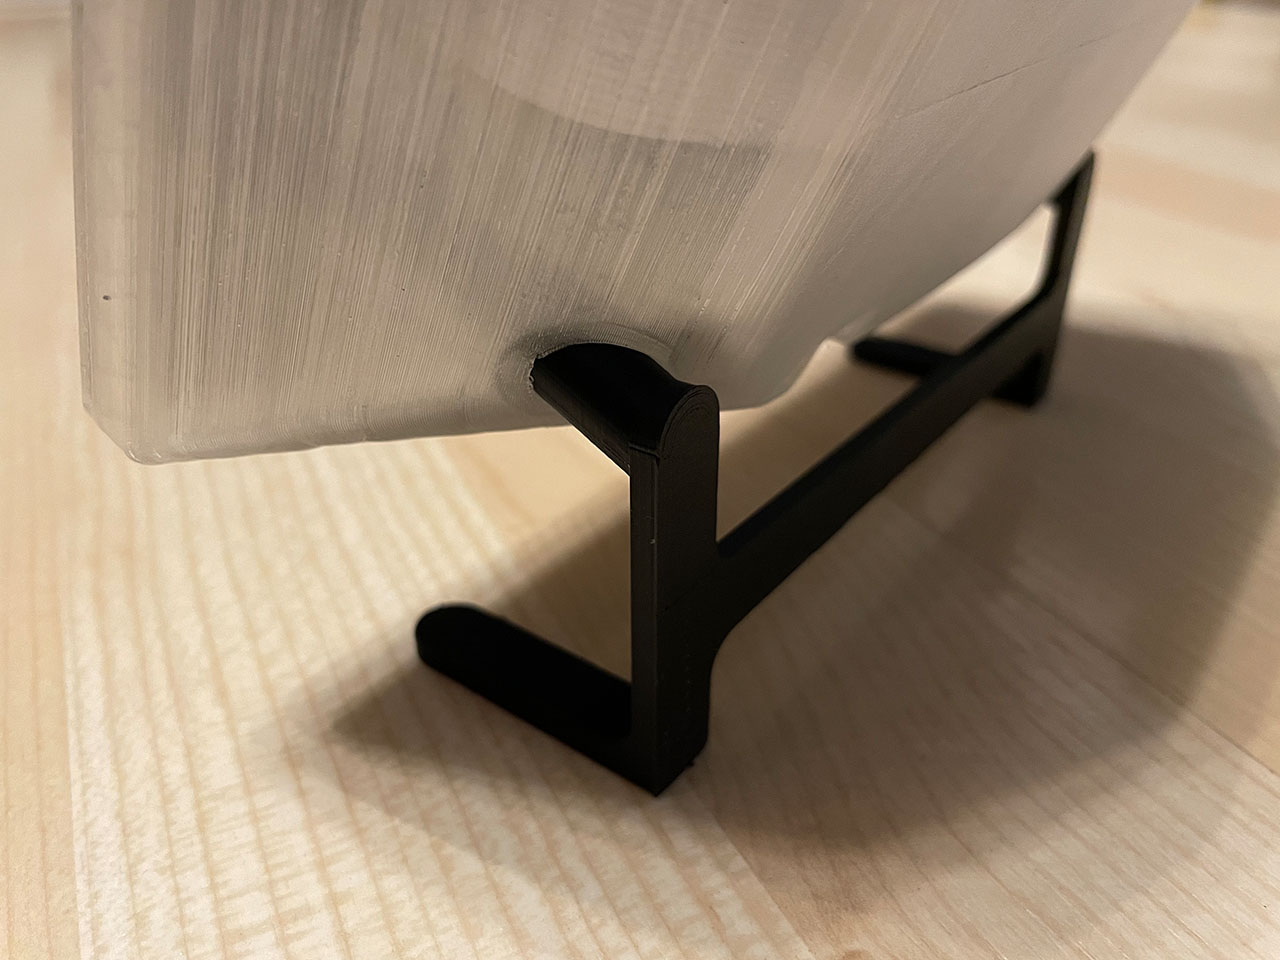
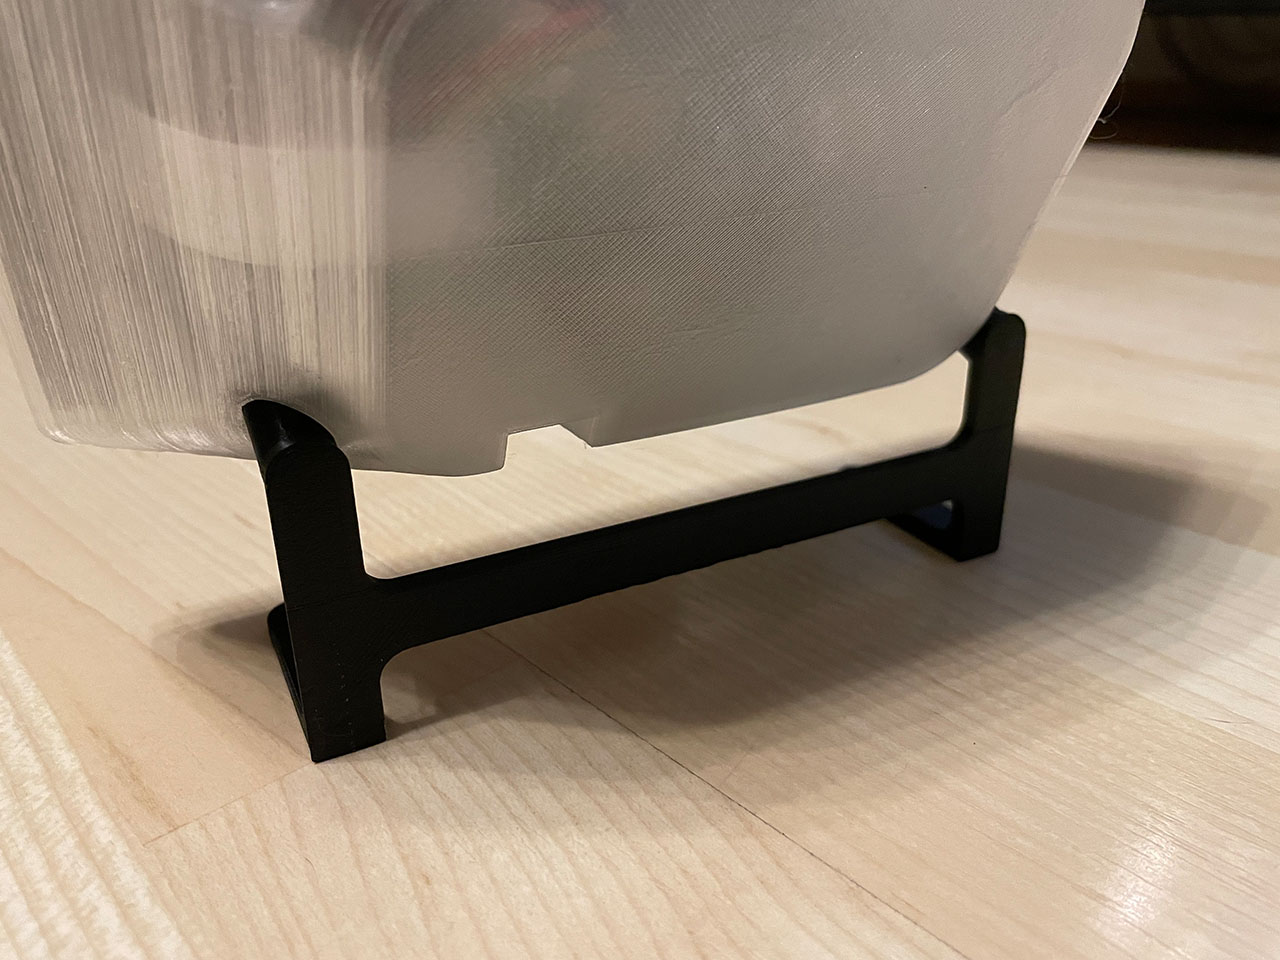
The case for the display
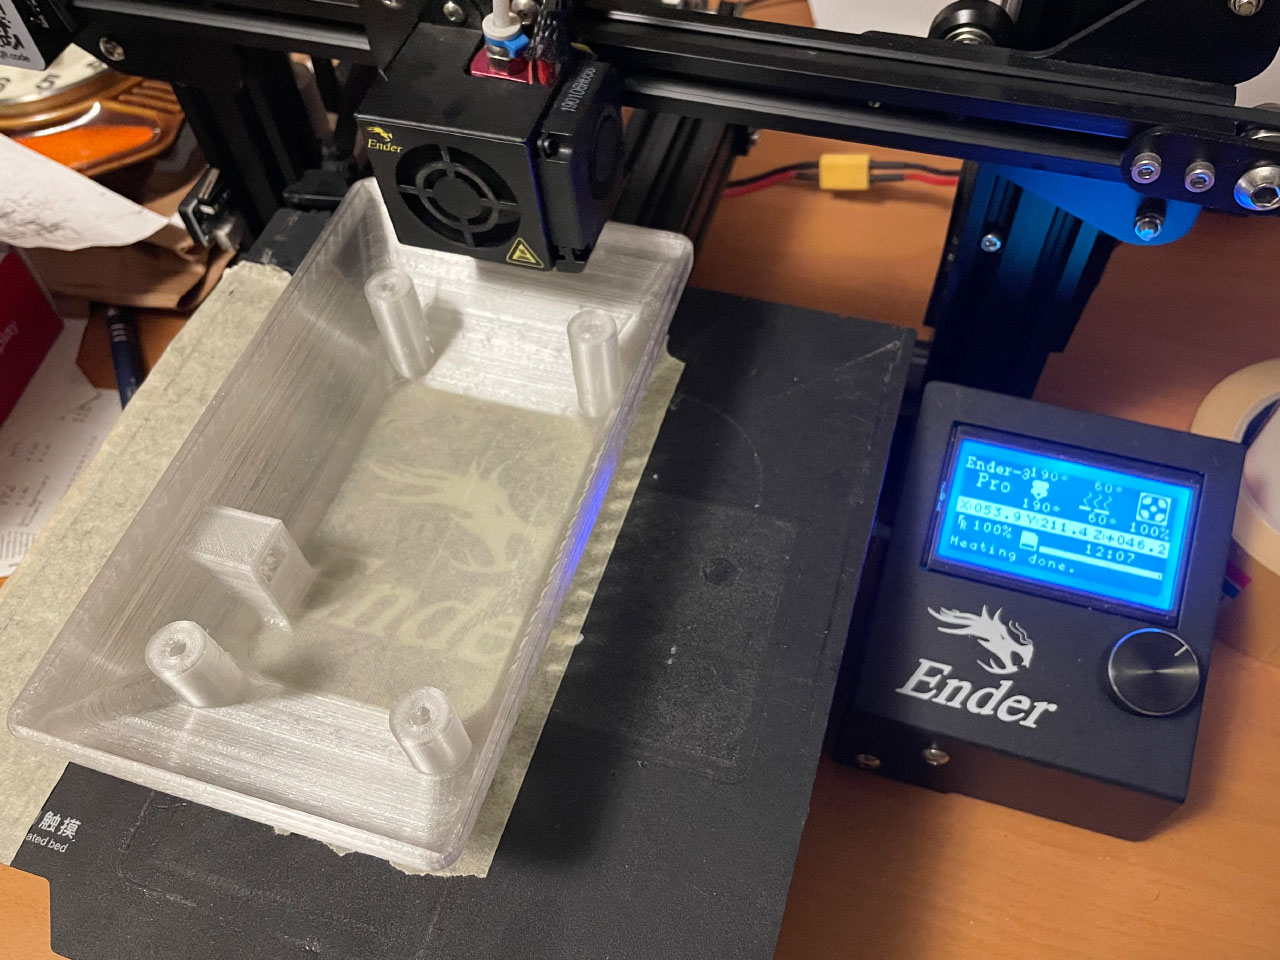
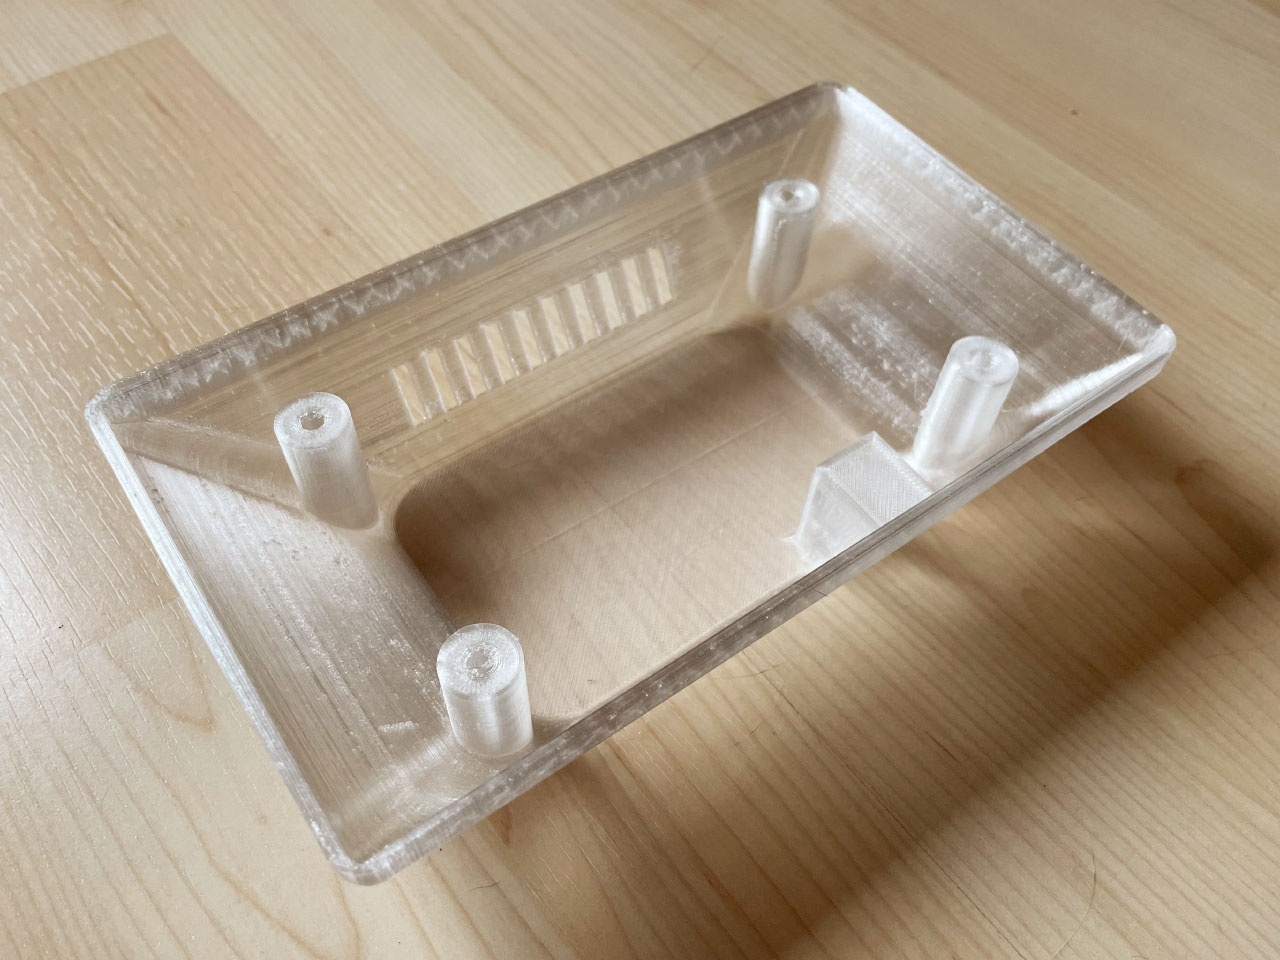
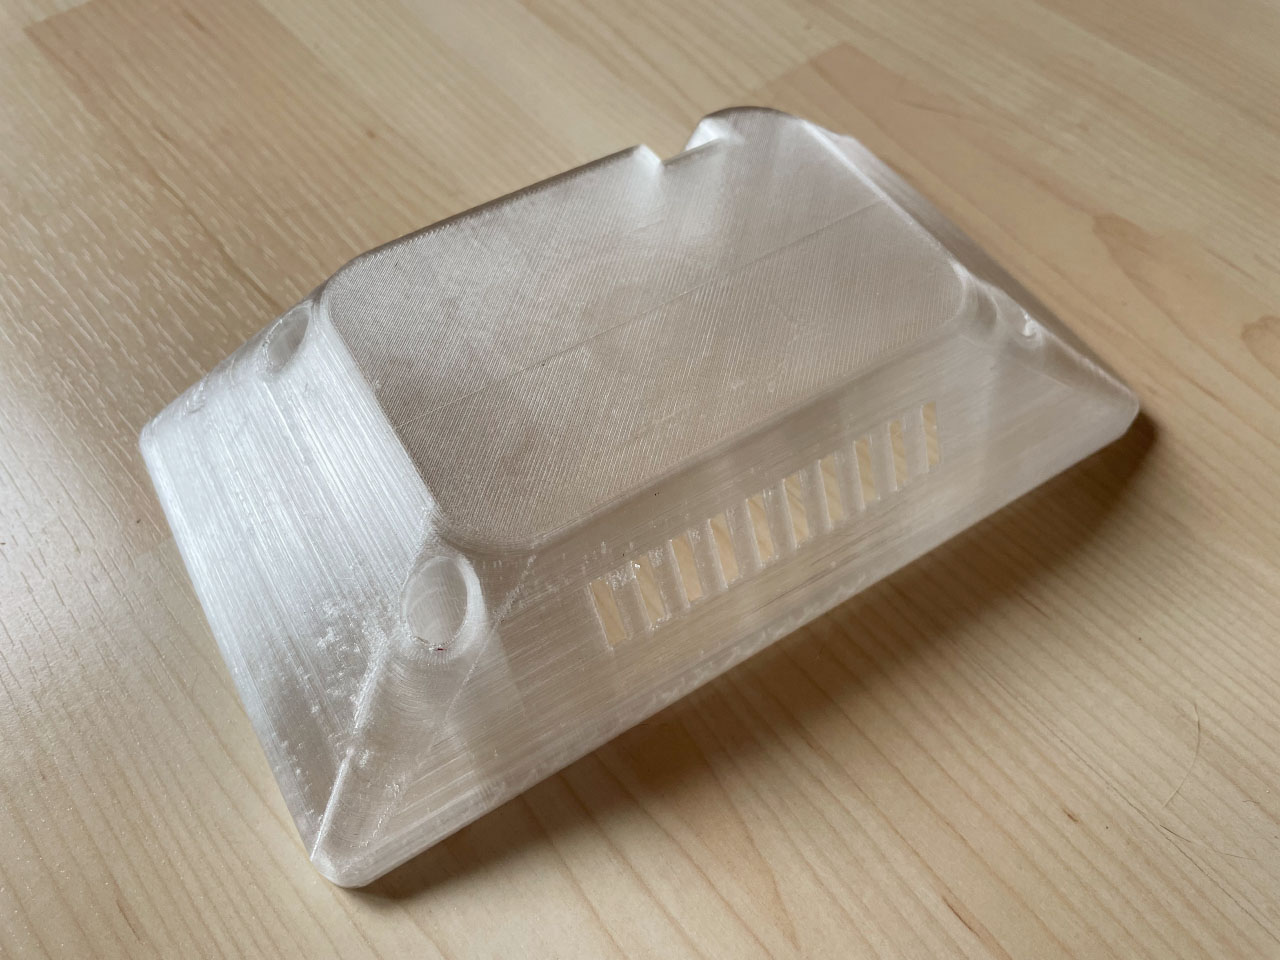
What is still missing is a case for the display and the Raspberry Pi that is suitable for the living room. There are a lot of 3D models on the internet that you can print yourself, but I didn't really like any of them. So I designed my own case. I admit, the construction is a bit risky because of the many overhangs, but my Ender 3 printed it quite well without any support structures. The STEP files of the enclosure are available on GitHub.


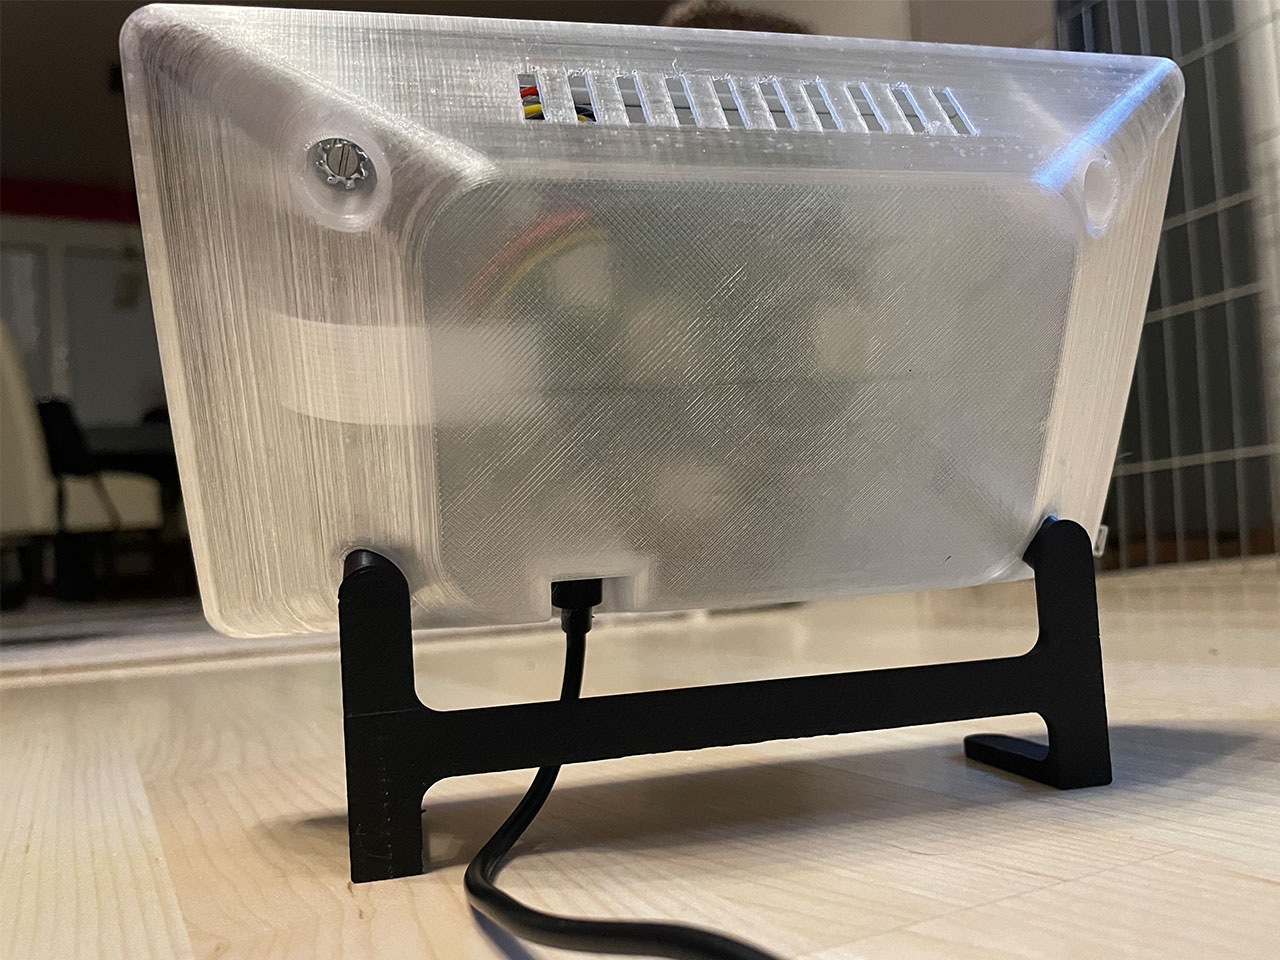
This completes the setup of the Raspberry Pi. Now the actual steps for installing the weather station begin.
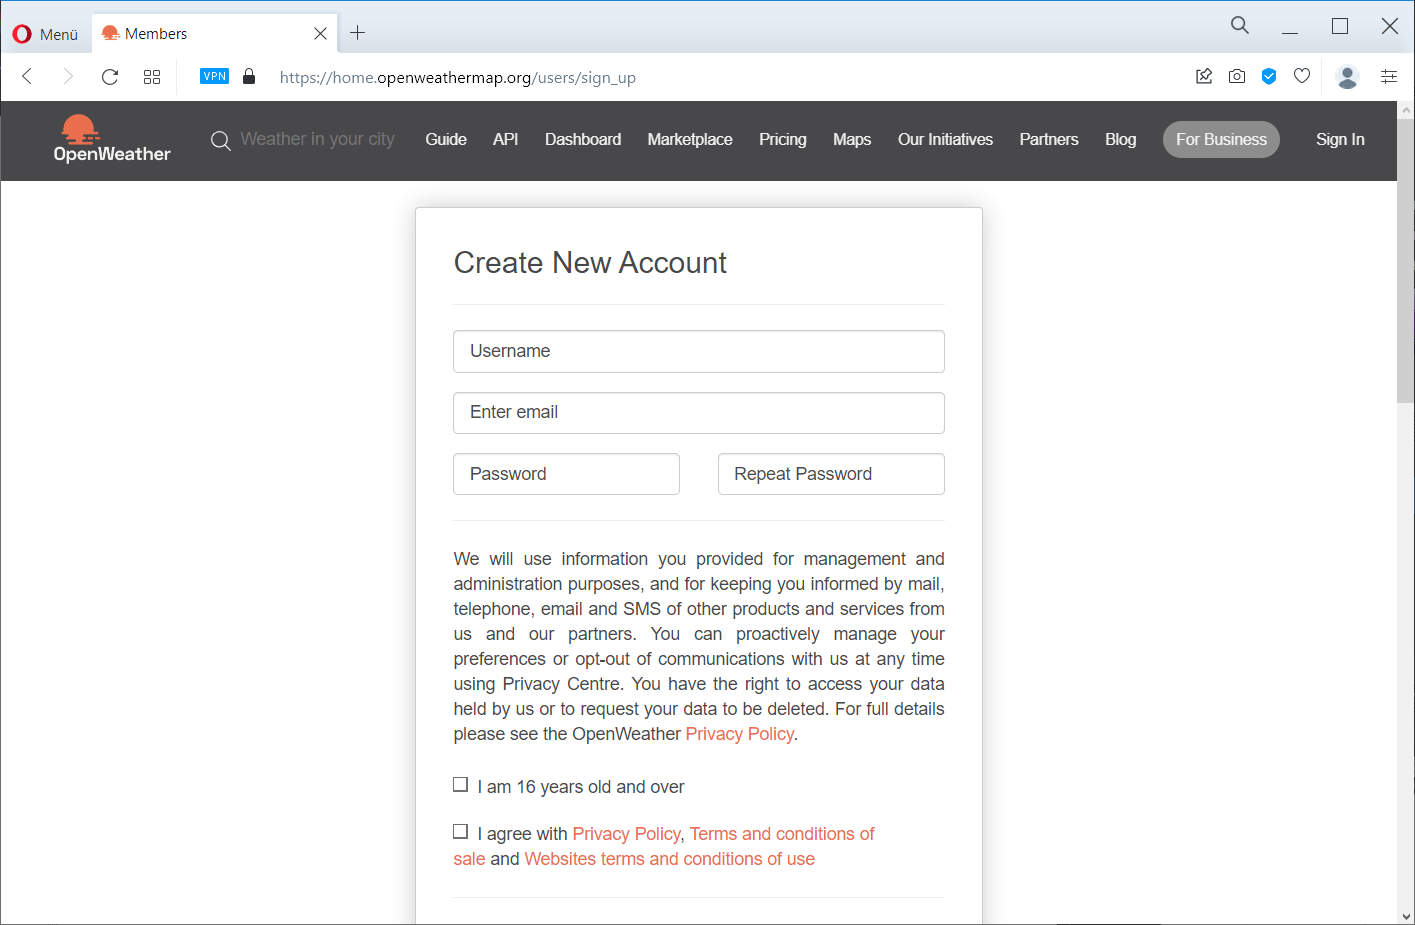
Set up an OpenWeather API account
Of course, the requirement for a weather forecast is the corresponding data. There are several companies now that offer interfaces for weather data, and for some companies this data is even free to a certain extent. OpenWeather is one of them, although the "Open" in the name has nothing to do with open source. In order to use the OpenWeather API, you must first register on the website. After registering, you will receive an email with a confirmation link. With this confirmation, you get access to the old API in version 2.5, which allows 60 calls per minute or 1,000,000 calls per month. The forecast lasts for 3 hours or 5 days.
For my weather station I use the new API 3.0. It is a so-called "pay as you call" API, so you pay for each individual call. However, the first 1000 calls per day are free, which is more than enough for the weather station. After all, you can get the latest weather forecast every (24 * 60 * 60) / 1000 = 86.4 seconds. With a single call, you get the following data:
- Minute forecast for 1 hour
- Hourly forecast for 48 hours
- Daily forecast for 8 days
- National weather warnings
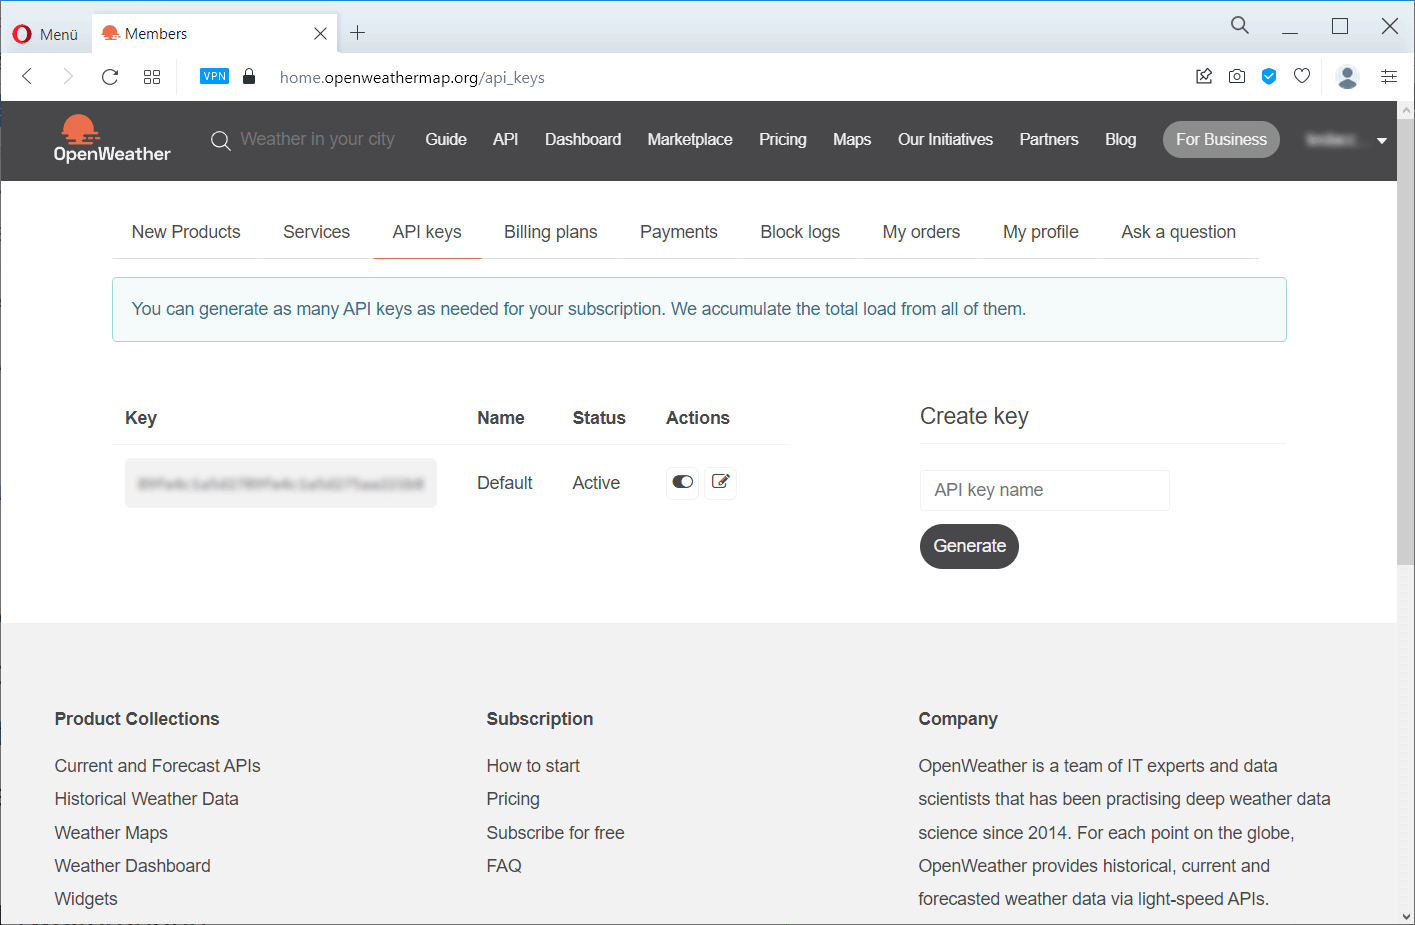
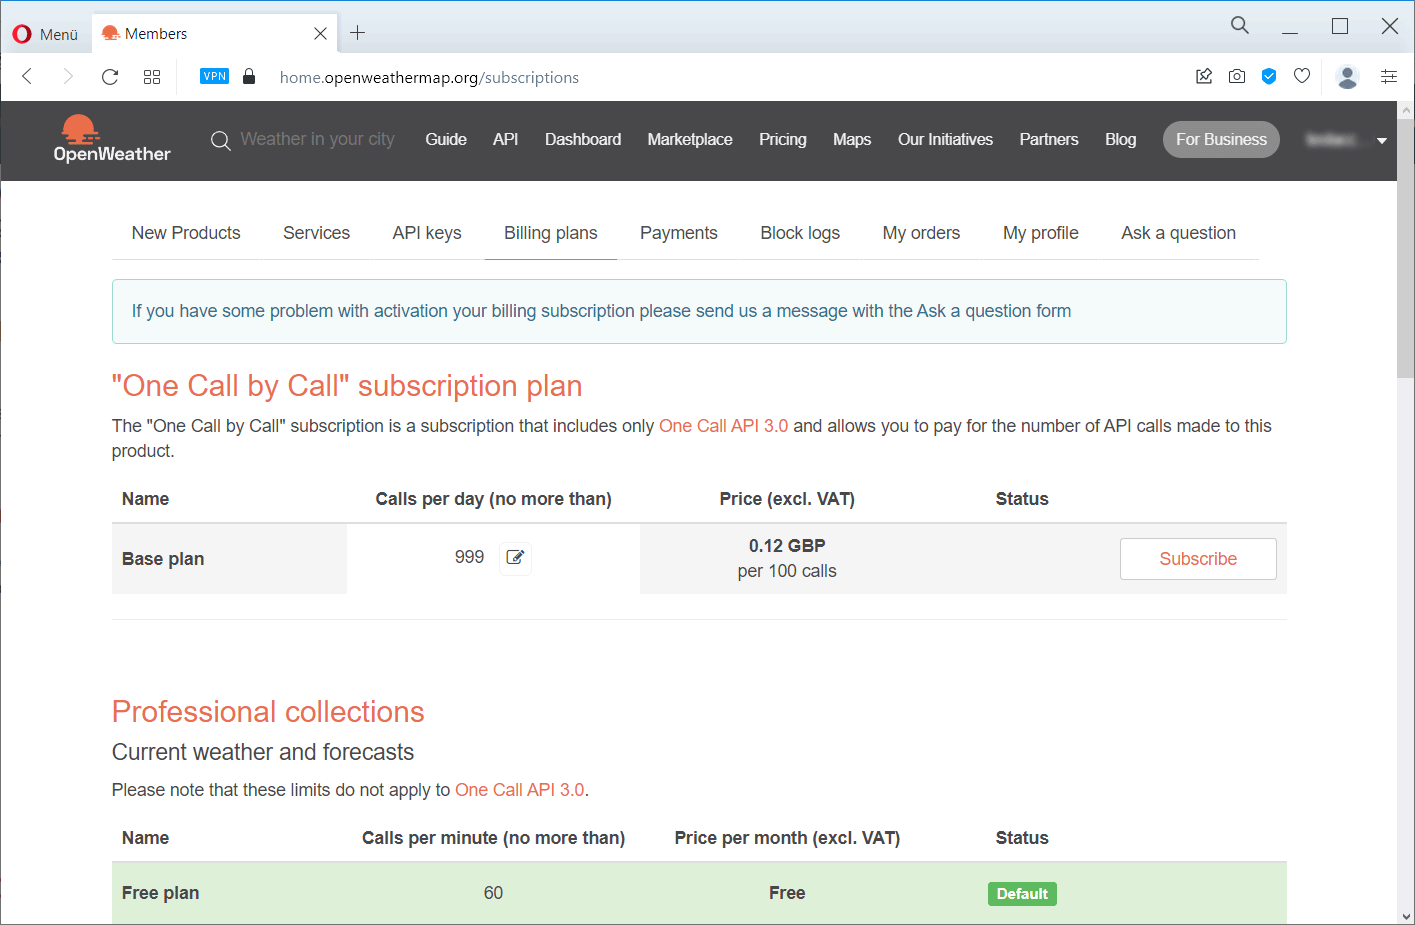
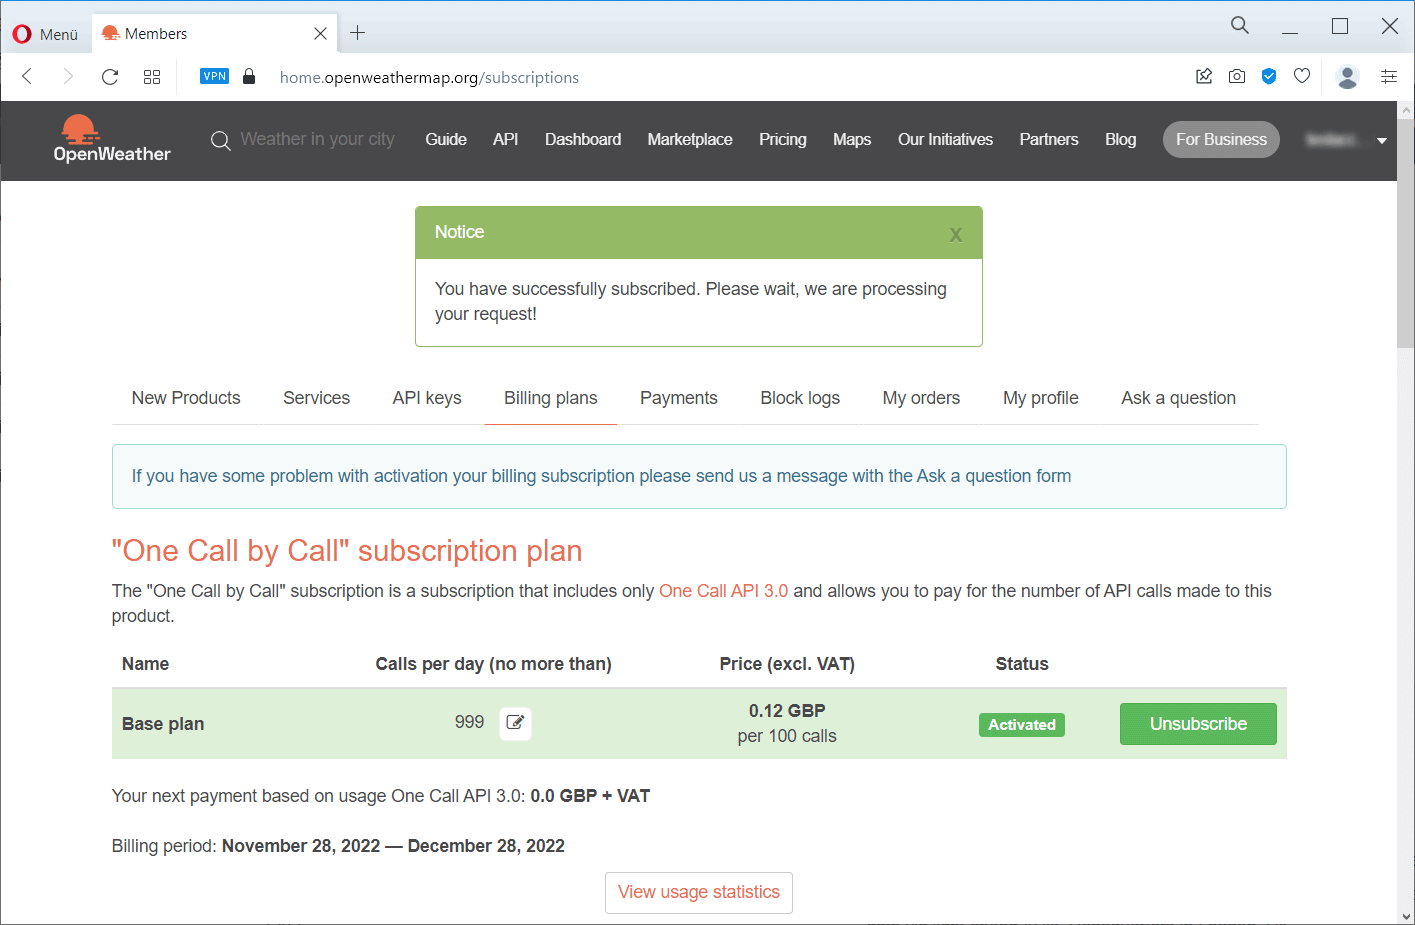
In order to use this API, however, a few more steps are needed. To do this, first go to the Billing plans tab. Here, the Base plan is offered for subscription, but don't be put off by the stated costs. As I said, the first 1000 calls are free. To ensure that you do not make more calls per day, you can enter a maximum number in the Call per day field. If you exceed this number, the API is automatically blocked. I simply entered 999 here to be on the safe side. The duration of the blocking is handled very strangely by OpenWeather. I quote from the FAQ: Our blocking system suspends your account for a couple of hours to several days randomly. If you want to be unlocked immediately, please subscribe to our paid subscriptions.
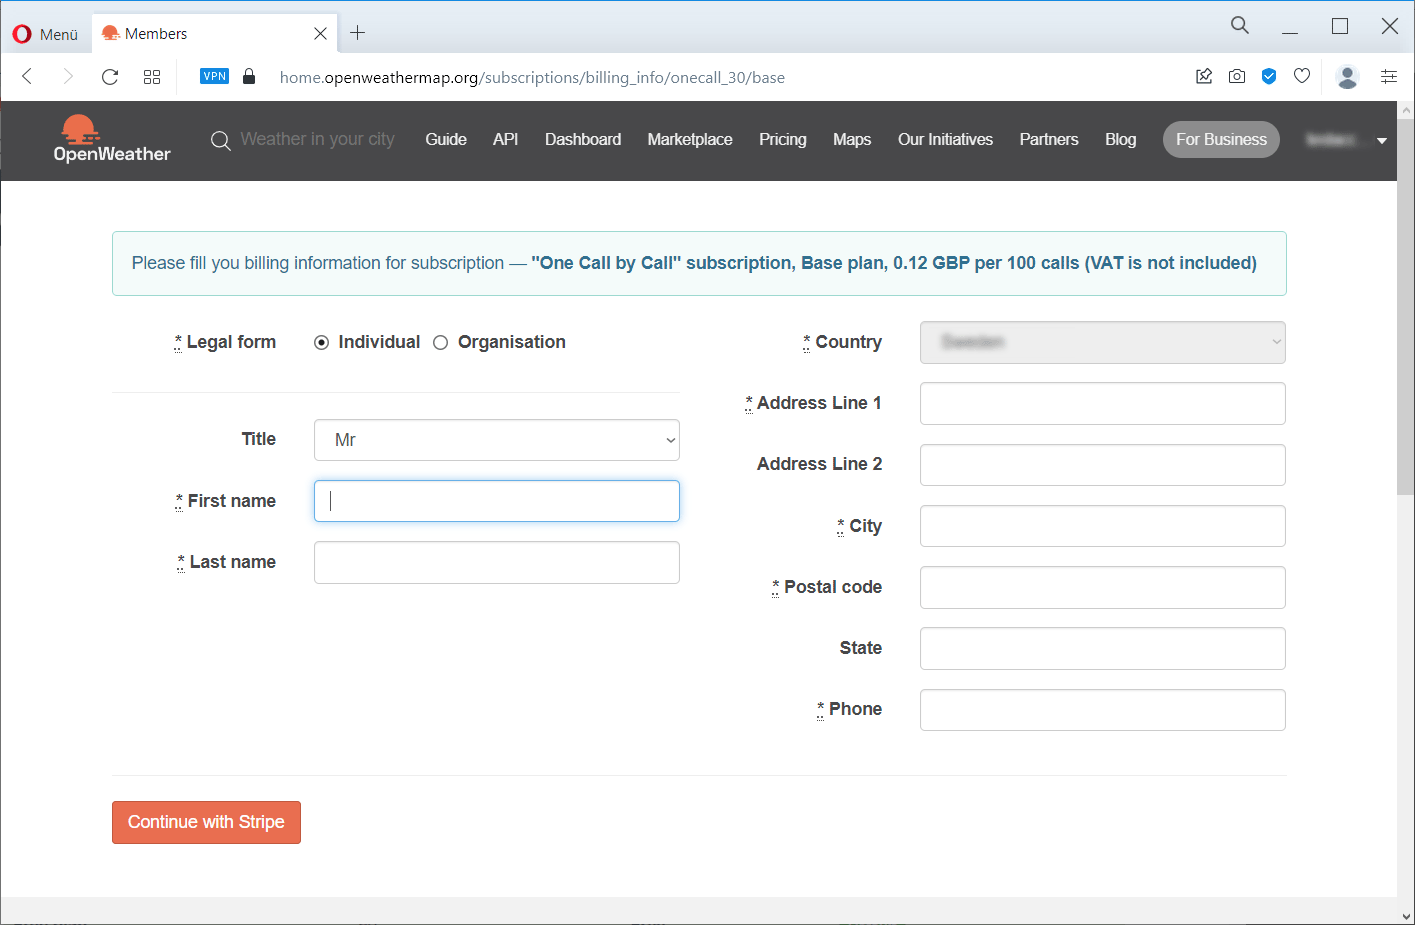
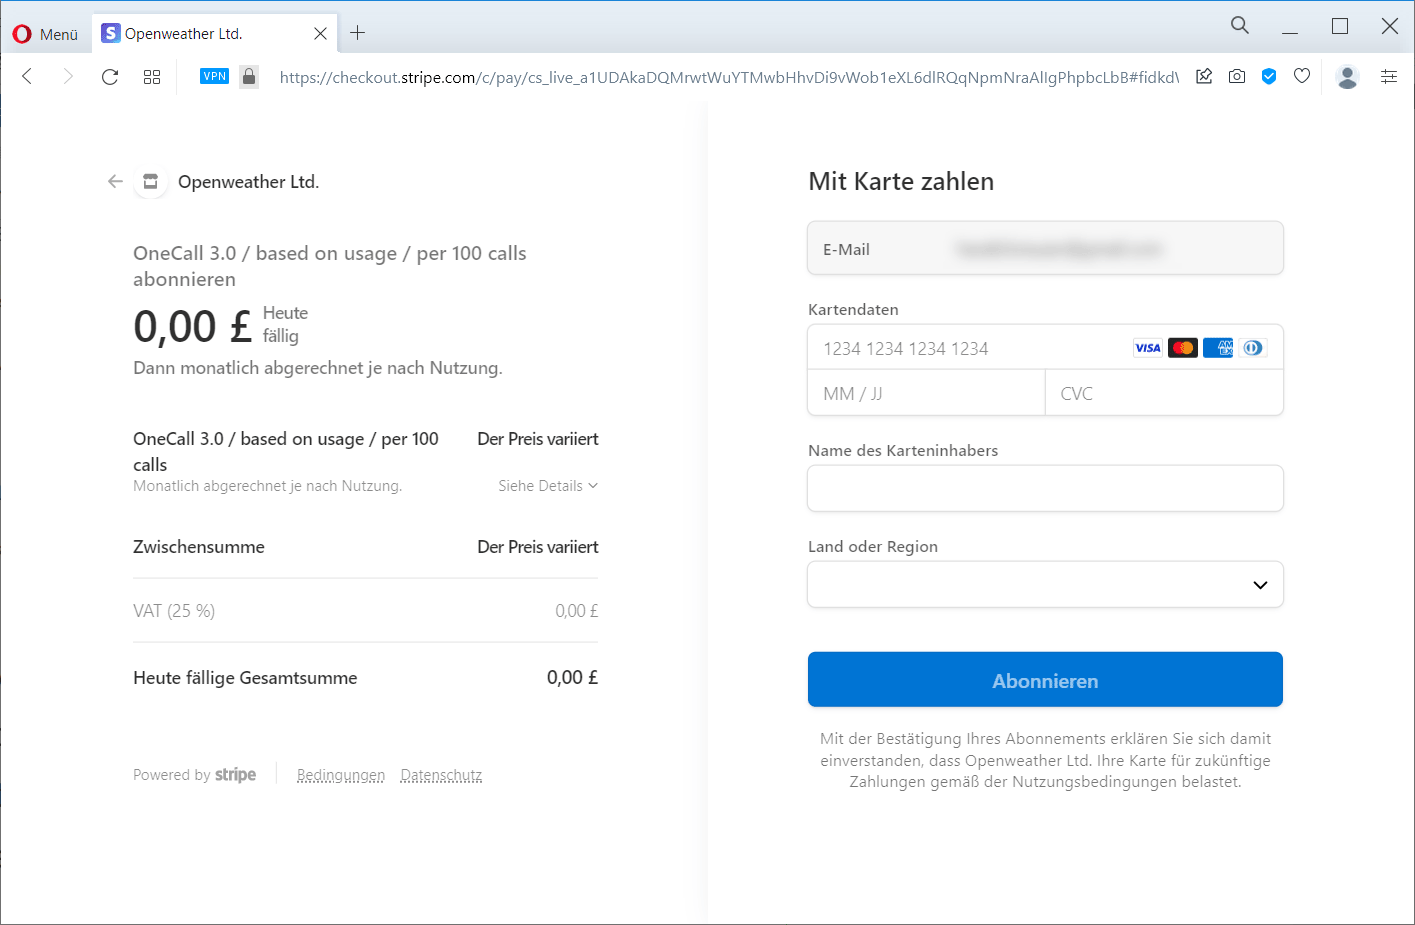
Next, click on Subscribe. Now the unpleasant part begins. Since this is a subscription for which you may automatically receive an invoice, you must provide a billing address and a valid credit card. You should never receive an invoice, but I can understand if this step puts you off. The subscription can be cancelled at any time. At the end, a page appears with the activated Base plan.
In addition, an e-mail is sent containing a test link that can be used to try out the API right away. However, it takes a few minutes until the link works. If you click on the link, the result should look something like this:
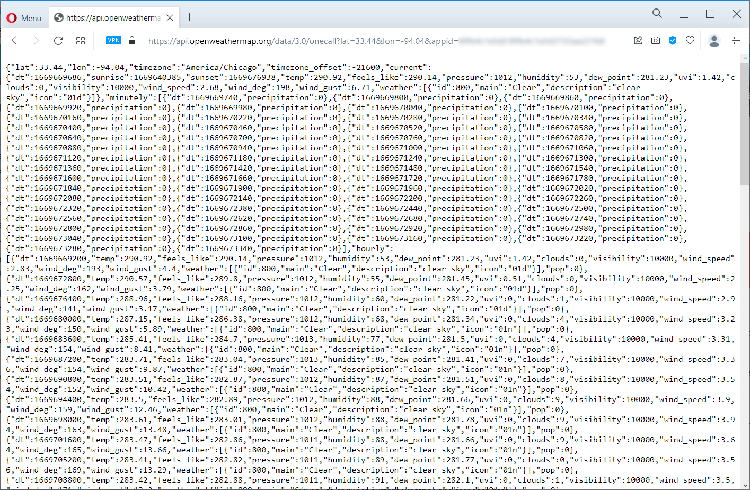
This now gives access to the current weather and the weather forecast for any place on earth.
MQTT-Broker Installation
MQTT, which was originally an acronym for Message Queue Telemetry Transport, is a network protocol that is very well suited for IoT applications because of its simplicity. The idea behind it is that the sender and receiver do not communicate directly with each other. They don't even need to know about each other. To do this, the sender, also called the publisher, sends the data with a topic to the so-called broker. A recipient, also called a subscriber, informs the broker that he is interested in a certain topic. As soon as messages with this topic arrive at the broker, they are sent to this recipient. The following diagram illustrates the process:
Mosquitto is an MQTT broker that can be installed on the Raspberry Pi in just a few steps. First, the server and a client are installed with this command:
sudo apt-get install mosquitto mosquitto-clients
Afterwards, the configuration is saved with
sudo nano /etc/mosquitto/conf.d/local.conf
to adjust the configuration. The content must look like this:
listener 1883
allow_anonymous true
persistence false
After this change, the service must still be restarted:
sudo systemctl restart mosquitto
The status of the service can be checked with this command:
sudo systemctl status mosquitto
The output should look like this:
● mosquitto.service - Mosquitto MQTT Broker
     Loaded: loaded (/lib/systemd/system/mosquitto.service; enabled; vendor preset: enabled)
     Active: active (running) since Mon 2022-12-05 11:47:51 CET; 12min ago
       Docs: man:mosquitto.conf(5)
             man:mosquitto(8)
    Process: 1094 ExecStartPre=/bin/mkdir -m 740 -p /var/log/mosquitto (code=exited, status=0/SUCCESS)
    Process: 1095 ExecStartPre=/bin/chown mosquitto /var/log/mosquitto (code=exited, status=0/SUCCESS)
    Process: 1096 ExecStartPre=/bin/mkdir -m 740 -p /run/mosquitto (code=exited, status=0/SUCCESS)
    Process: 1097 ExecStartPre=/bin/chown mosquitto /run/mosquitto (code=exited, status=0/SUCCESS)
   Main PID: 1098 (mosquitto)
      Tasks: 1 (limit: 407)
        CPU: 395ms
     CGroup: /system.slice/mosquitto.service
             └─1098 /usr/sbin/mosquitto -c /etc/mosquitto/mosquitto.conf

Dec 05 11:47:51 WeatherStation systemd[1]: Starting Mosquitto MQTT Broker...
Dec 05 11:47:51 WeatherStation mosquitto[1098]: 1670237271: Loading config file /etc/mosquitto/conf.d/local.conf
Dec 05 11:47:51 WeatherStation systemd[1]: Started Mosquitto MQTT Broker.
With the client installed above, the broker can be tested on the Raspberry Pi. To do this, two terminals must be opened. A subscriber is started in the first terminal:
mosquitto_sub -h localhost -t /test/topic
A message is sent in the second terminal:
mosquitto_pub -h localhost -t /test/topic -m "Just a test"
This message should now be printed in the first console.
The Message Broker is now installed on the Raspberry Pi and ready to receive messages from the sensors.
Weather station application
The base station is implemented in Python and uses the Kivy framework for the user interface. My goal was to show as much data as possible on the 7 inch display.
Installing the application
The application needs some libraries before it can be started. To do this, connect to the Raspberry Pi via ssh and execute the following commands:
sudo apt-get install python3-yaml
sudo apt-get install python3-paho-mqtt
sudo apt-get install python3-scipy
In the configuration, the locale de_DE.utf8 will be used. This locale must be installed on the Raspberry Pi. This can be checked with the command
sudo dpkg-reconfigure locales
and installed if necessary.
After that, the autostart must be set up so that the weather station is started automatically after the Raspberry Pi is switched on.
To do this, create a unit file with this command:
sudo nano /lib/systemd/system/weatherstation.service
and insert this content:
[Unit]
 Description=WeatherStation
 After=multi-user.target

 [Service]
 Type=idle
 User=pi
 Group=pi
 ExecStart=/usr/bin/python /home/pi/WeatherStation/weather_station_app.py

 [Install]
 WantedBy=multi-user.target
The permissions for this file still need to be adjusted:
sudo chmod 644 /lib/systemd/system/weatherstation.service
Finally, the service is activated:
sudo systemctl daemon-reload
sudo systemctl enable weatherstation.service
Now the application is set up. After a restart, the application should start automatically.
The code for the application can be found on GitHub.
Configuration of the application
In the config.yaml file, all parameters are defined that are necessary for operation. Especially important are the API key of OpenWeather, the GPS coordinates for which the weather will be retrieved and the IP address of the MQTT broker. The configuration looks like this:
openweather:
  url: https://api.openweathermap.org/data/3.0/onecall
  lat: 48.2149546
  lon: 16.302153494876826
  units: metric
  lang: de
  appid: xxxxxxxxxxxxxx    # your api key
  interval: 300  # Call every 5 Minutes (300 seconds), so we have 288 calls per day

kivy:
  kv_directory: templates
  locale: de_DE.utf8
  mqtt_host: 192.168.0.200
  temperature_unit: °C
  pressure_unit: hPa
  humidity_unit: '%'
  battery_unit: V
  wifi_unit: dBm
  wind_unit: m/s
  clouds_unit: '%'
The layout is defined, as usual in Kivy, by a KV file. Among other things, it defines which class the respective widget uses and which sensor delivers the values. This area looks like this:
CurrentWidget:
    id: current_widget
    size_hint: 0.46, 1
SensorBme280Widget:
    name: "Balkon"
    topic: '/weatherstation/sensor/00'
    size_hint: 0.18, 1
SensorBme280Widget:
    name: "Wohnzimmer"
    topic: '/weatherstation/sensor/01'
    size_hint: 0.18, 1
SensorBme280Widget:
    name: "Schlafzimmer"
    topic: '/weatherstation/sensor/02'
    size_hint: 0.18, 1
So far there is only the class SensorBme280Widget, because all sensor modules run with this sensor. In the case of a sensor module with a different or additional sensor, one would define an additional class here that displays these values.
The layout of the application
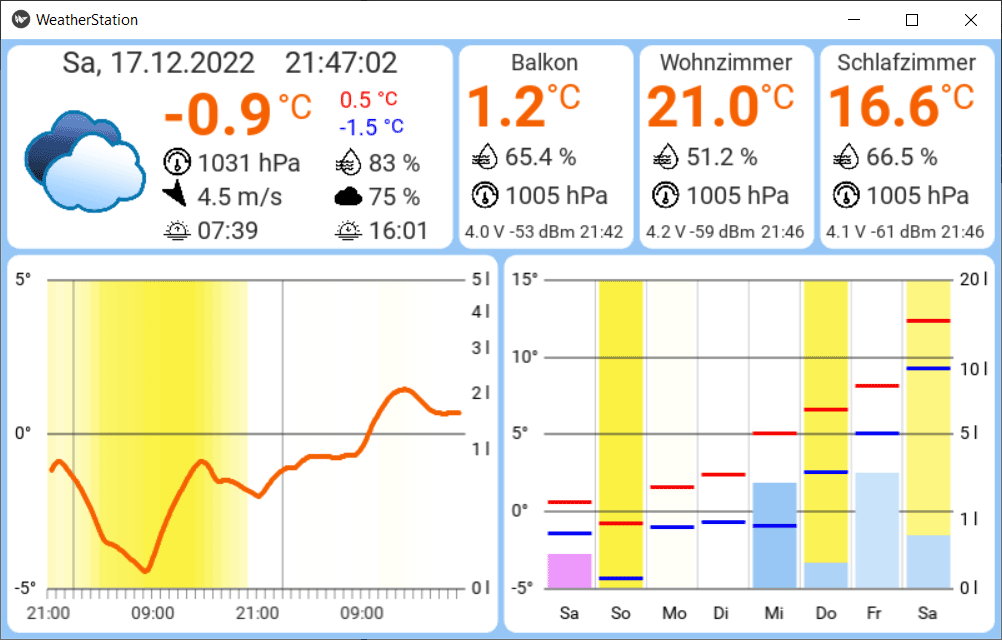
The layout basically consists of two areas. At the top right, the values of up to three sensors are displayed. This includes the actual values of the sensor as well as data about the status of the sensor such as battery voltage, signal strength of the WLAN connection and time of the last update. The remaining area is used to display the weather forecast and shows the current readings, an hourly forecast for 48 hours and a daily forecast for 8 days. The blue and purple bars represent the amount of precipitation for rain and snow, where blue represents rain and purple represents snow. The intensity of the color indicates the probability of precipitation. The yellow background symbolizes the cloudiness level, the more yellow the less clouds.
In the future, I would like to show even more data on the display. The challenge is how to keep the display concise. I would be very grateful for any ideas.
Sensor module
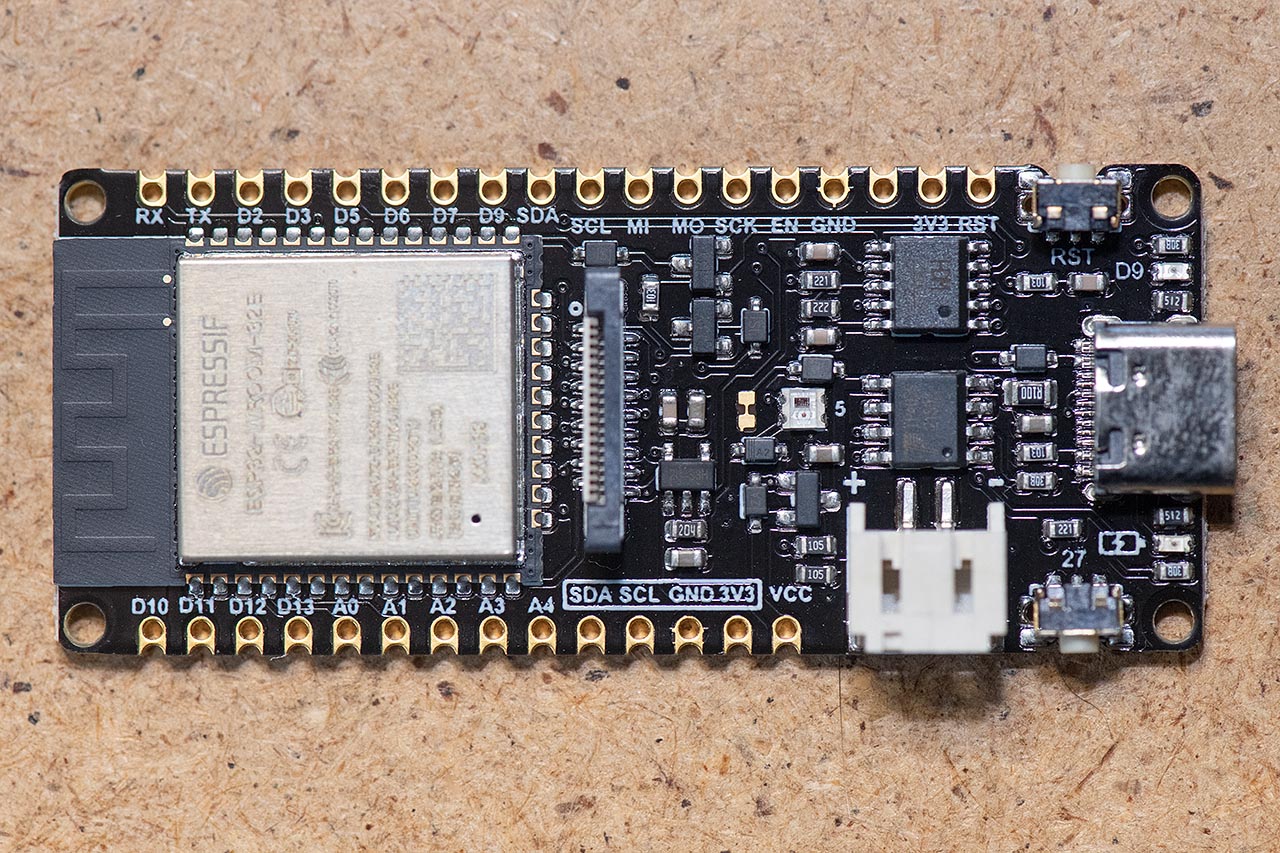
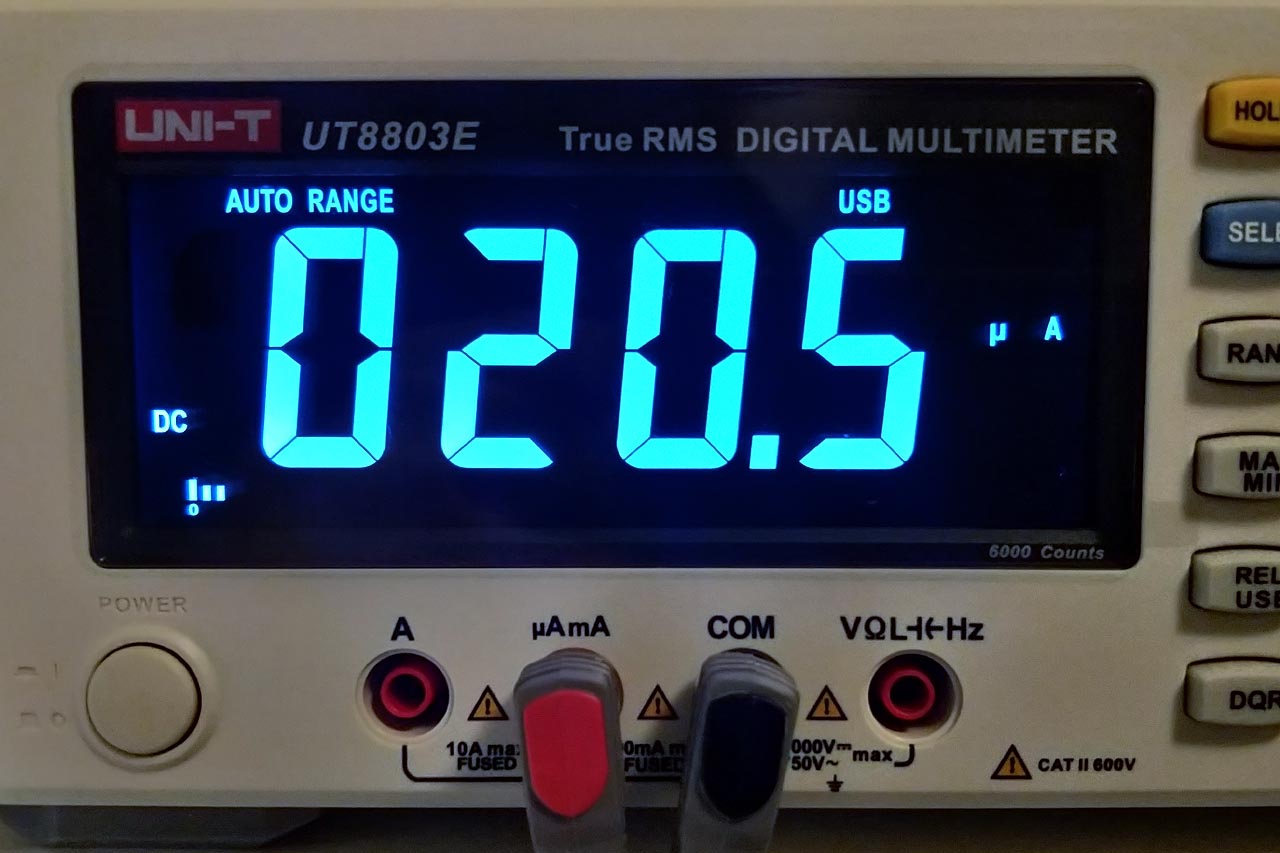
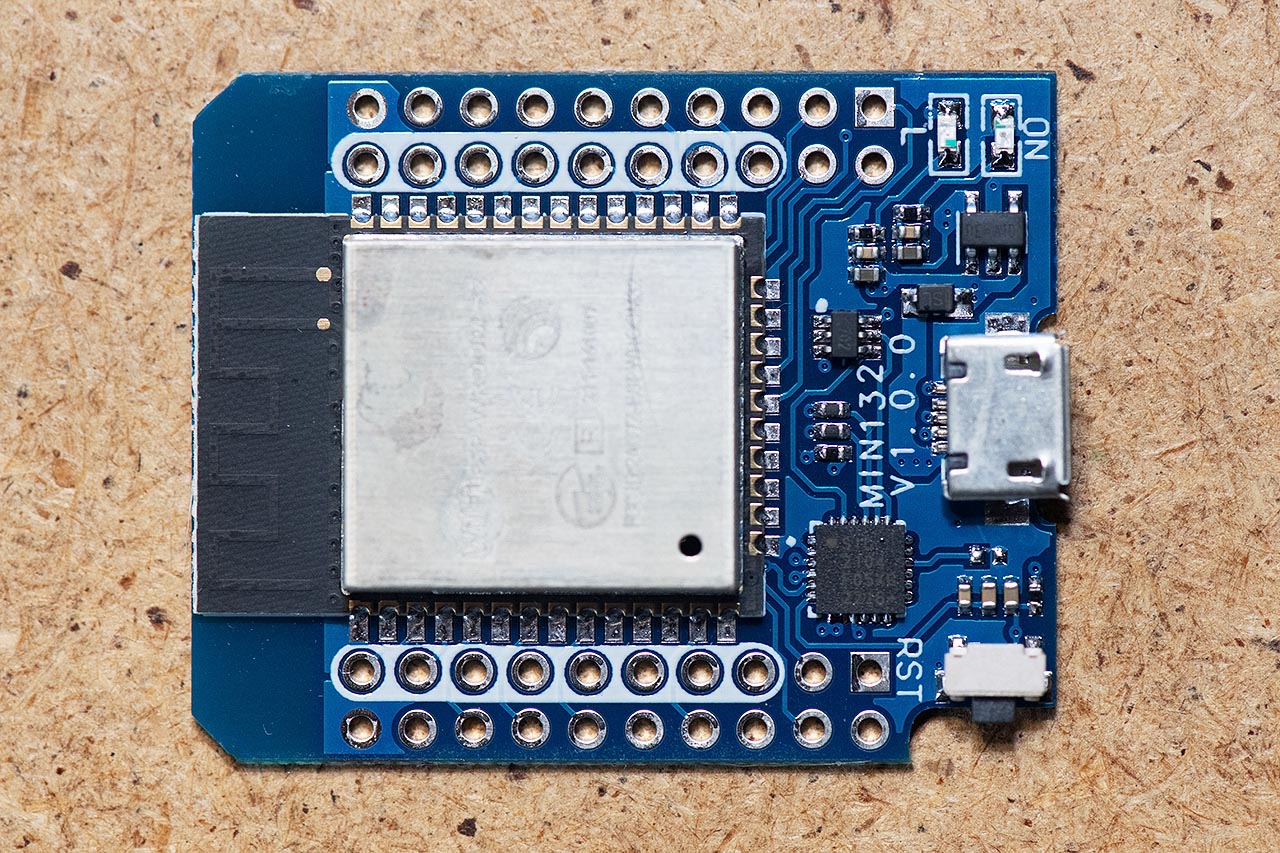
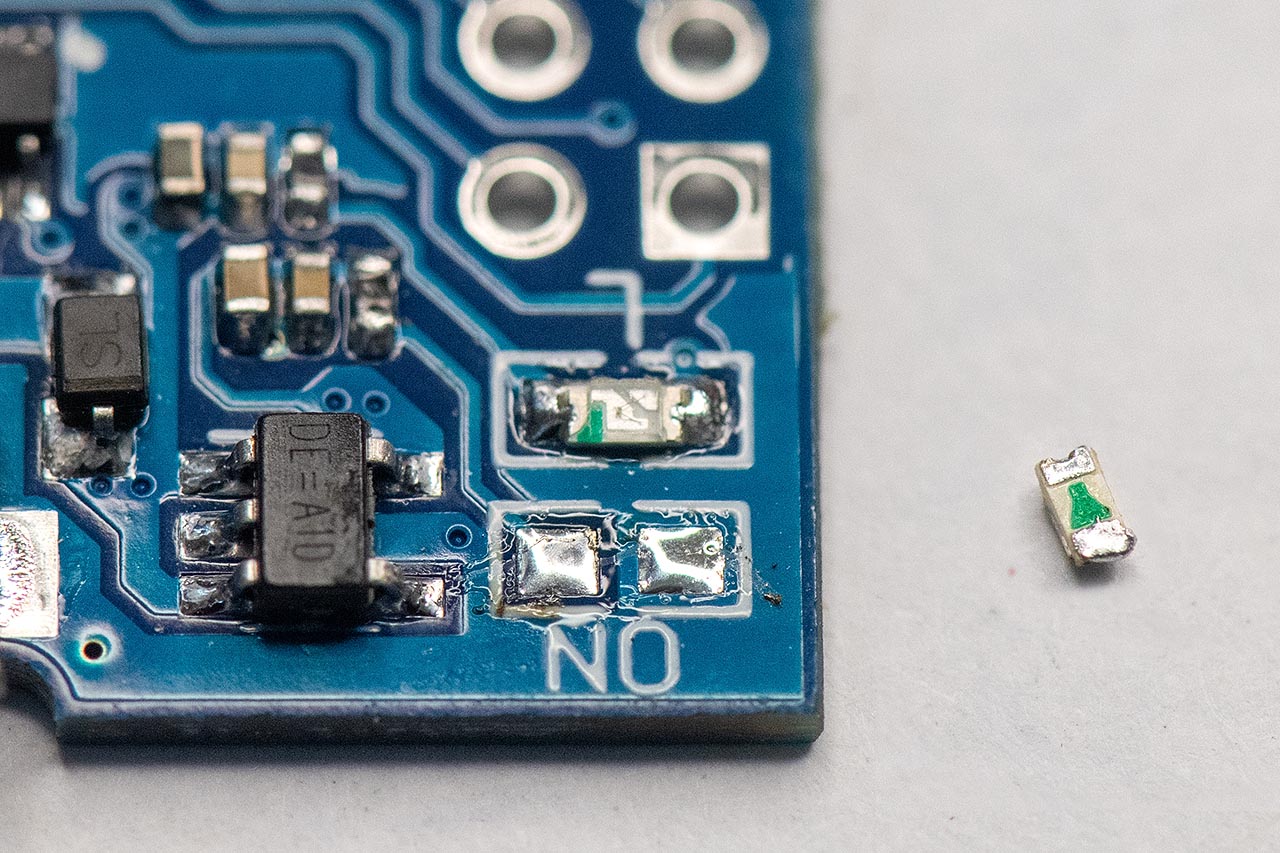
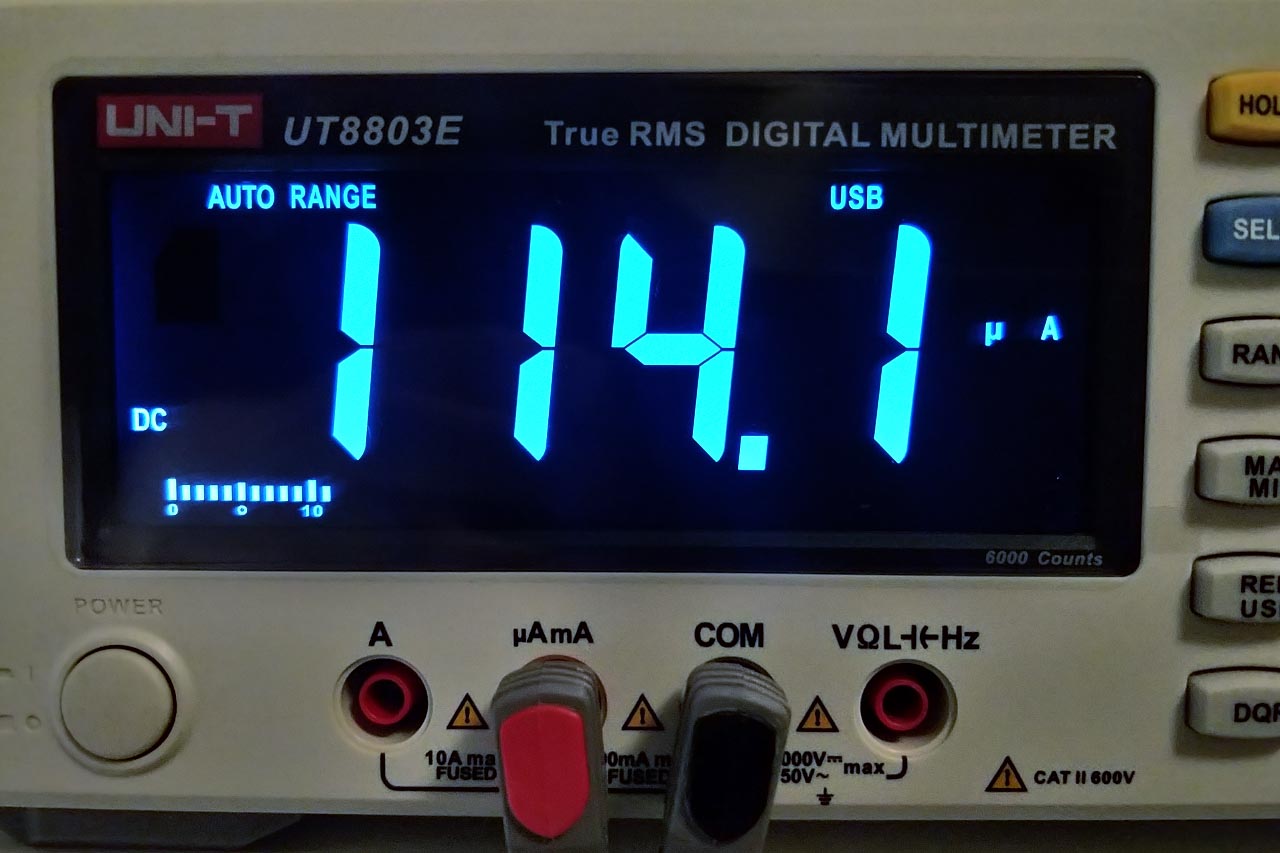
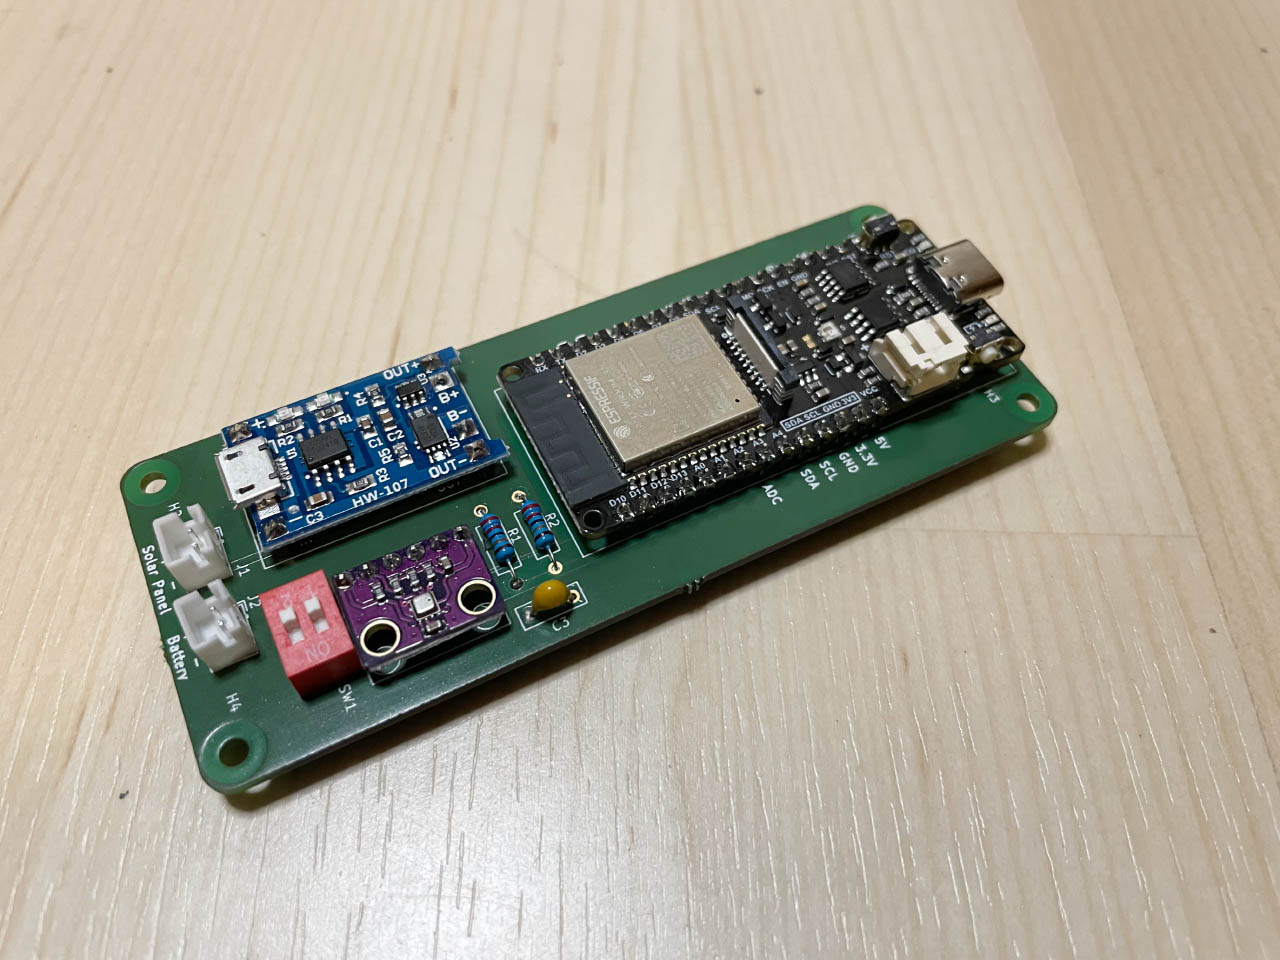
The task of the sensor module is to send the data of the sensor to the base station in the most power-saving way possible. The choice of the ESP32 was obvious, as I have been able to gain a lot of experience with this microcontroller in the last few months. There are many ESP32 boards available now, which differ significantly in terms of power consumption. A video by Andreas Spiess was very helpful here, where some boards are compared. I chose the FireBeetle 2 board because, according to the data sheet, it only consumes 13 µA in deep sleep mode. Other boards, including the ESP32-DevKitC from Espressif, consume much more. This low power consumption is achieved by the RT9080 voltage regulator, which has a quiescent current of only 2 μA. The entire sensor module thus has a power consumption of only 20 µA in deep sleep mode. However, you have to cut the thin wire in the middle of the board so that the RGB LED is no longer supplied with power. I can't really understand why they didn't just use a jumper here.
For comparison, I tried an ESP32 D1 Mini Board, which consumes over 100 µA, five times as much in deep sleep mode. And this despite the fact that I have desoldered the LED indicating the power supply.
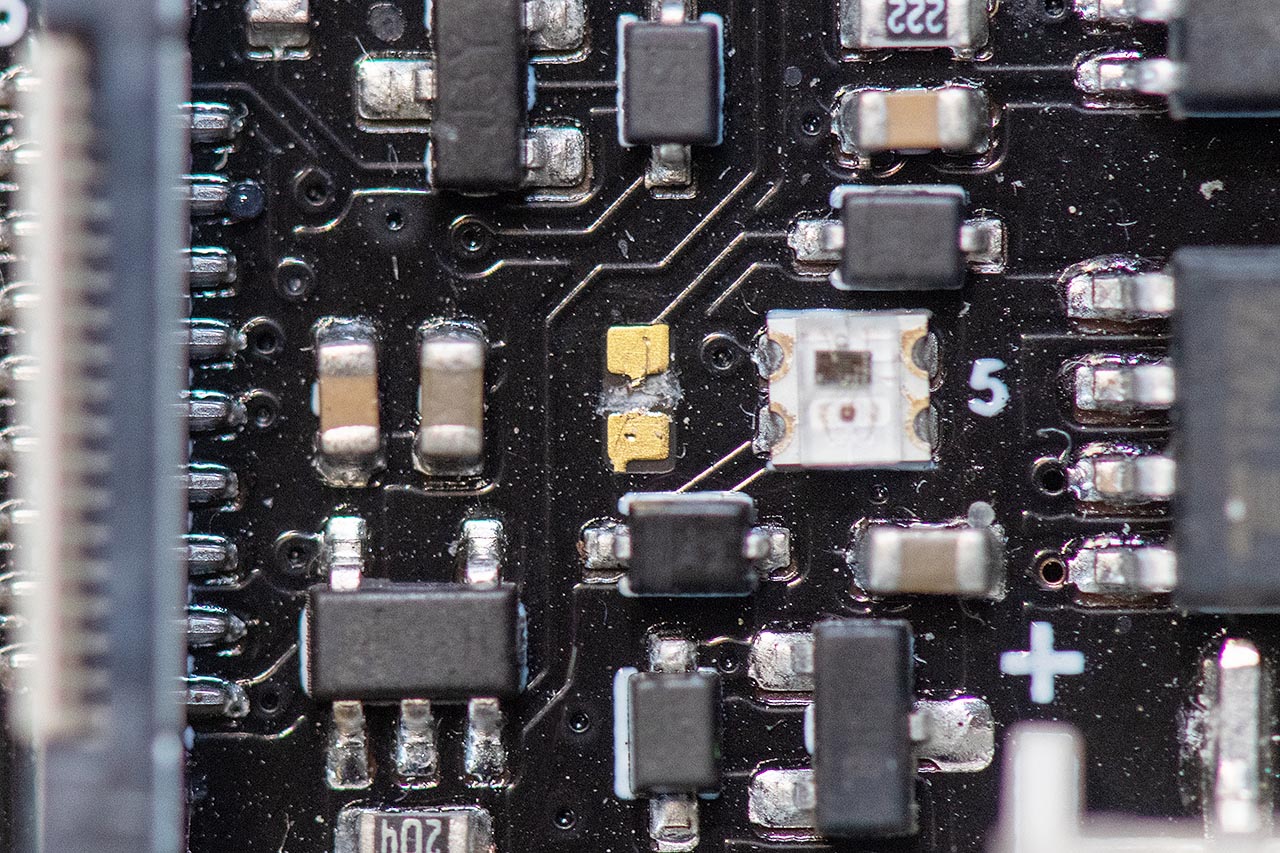
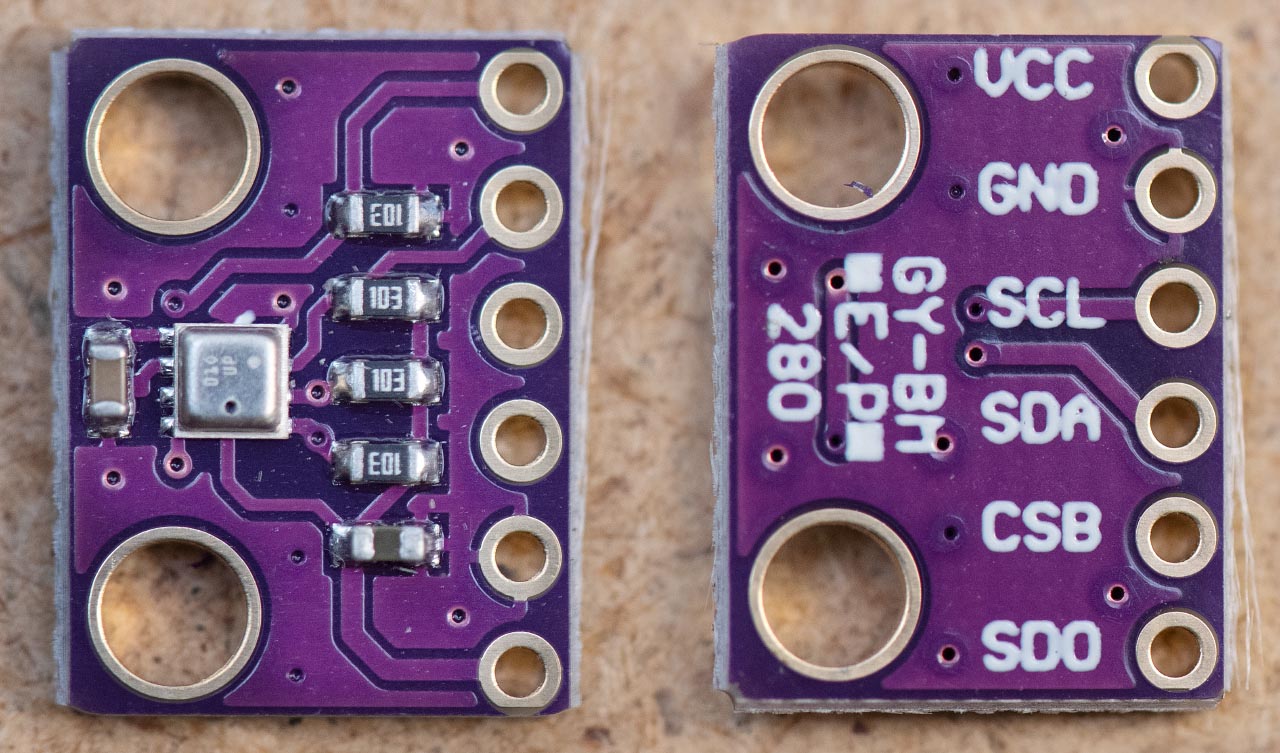
There is a wide range of sensors for measuring temperature. I have limited myself to those that can be controlled via the I2C interface. There are numerous comparisons of such sensors on the internet and I finally decided on the BME280 from Bosch. This sensor can measure temperature, humidity and air pressure. The BME280 does have the problem that it heats up slightly during operation and thus distorts the temperature, but since I only take a measurement every 10 minutes, this shouldn't matter.
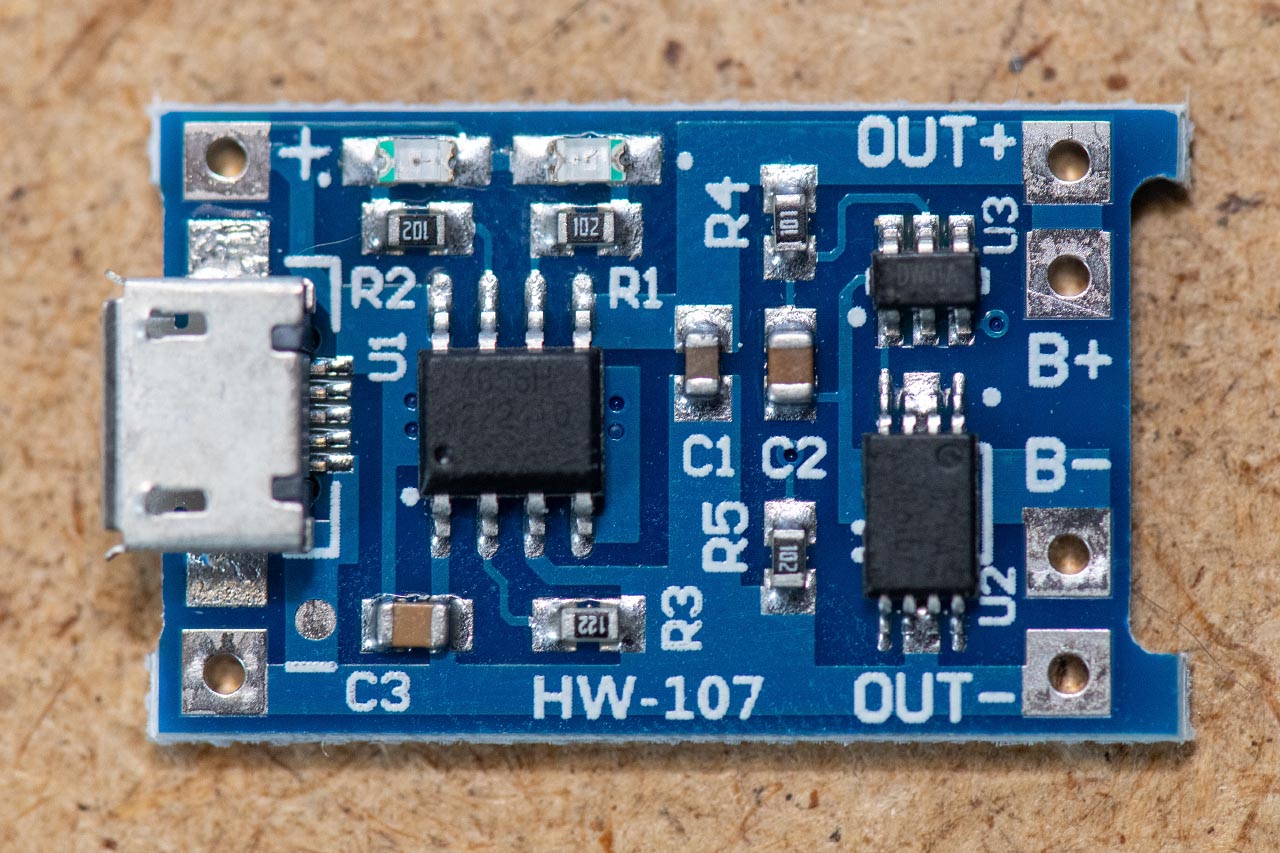
Since the board has to be charged via solar cells, a charge controller is also needed. The Firebeetle would already have a charge controller on board, but it is only designed for 5 volts. Since the USB controller on the board is directly connected to this power supply, it could be damaged if the voltage of the solar cell is higher, and besides, it is permanently in operation, which would unnecessarily increase the power consumption. Therefore, I decided to use a board based on a TP4056 charge controller that protects the battery against overcharging and deep discharging.
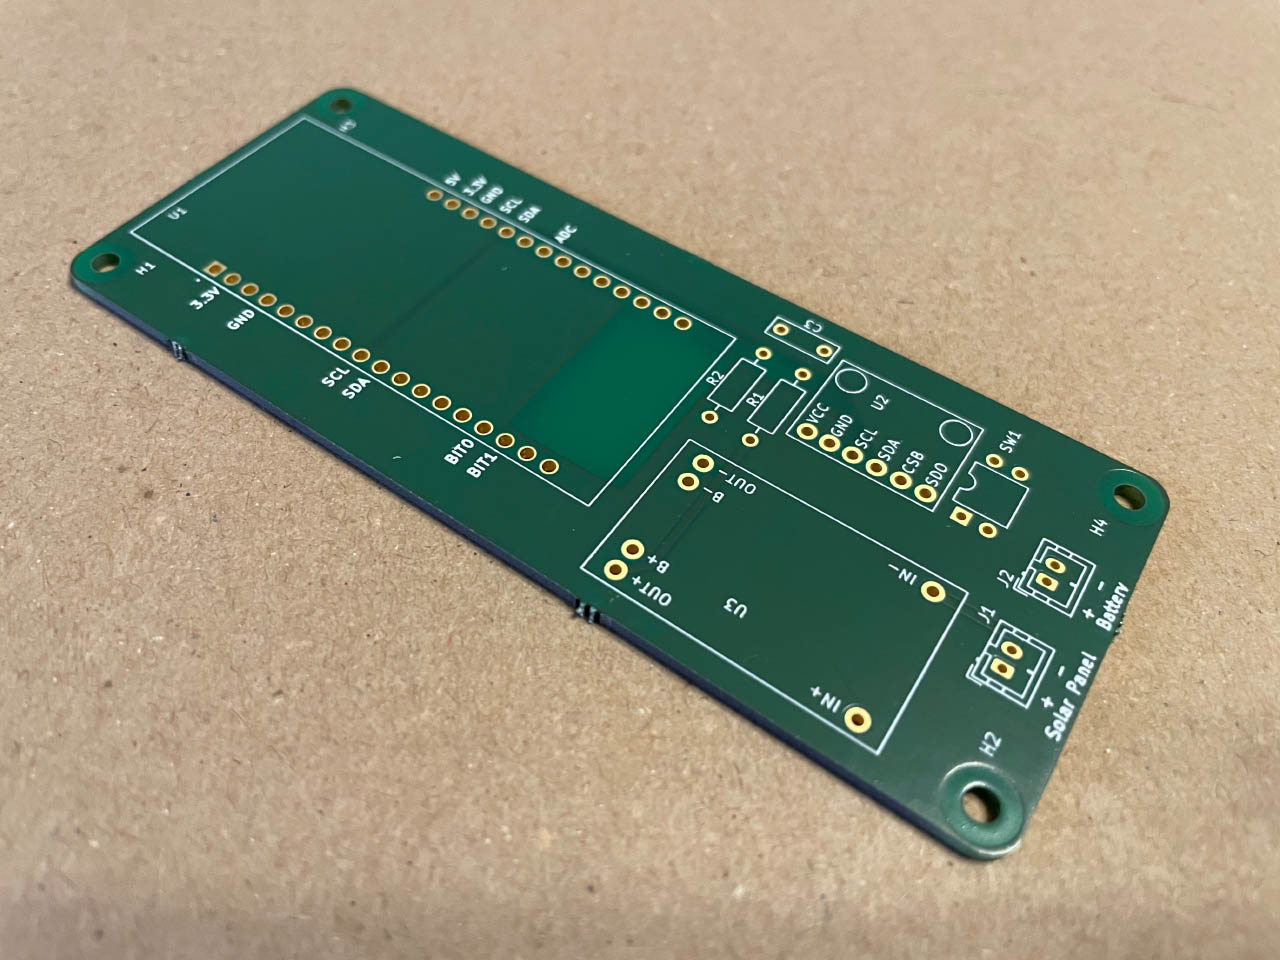
Electronics
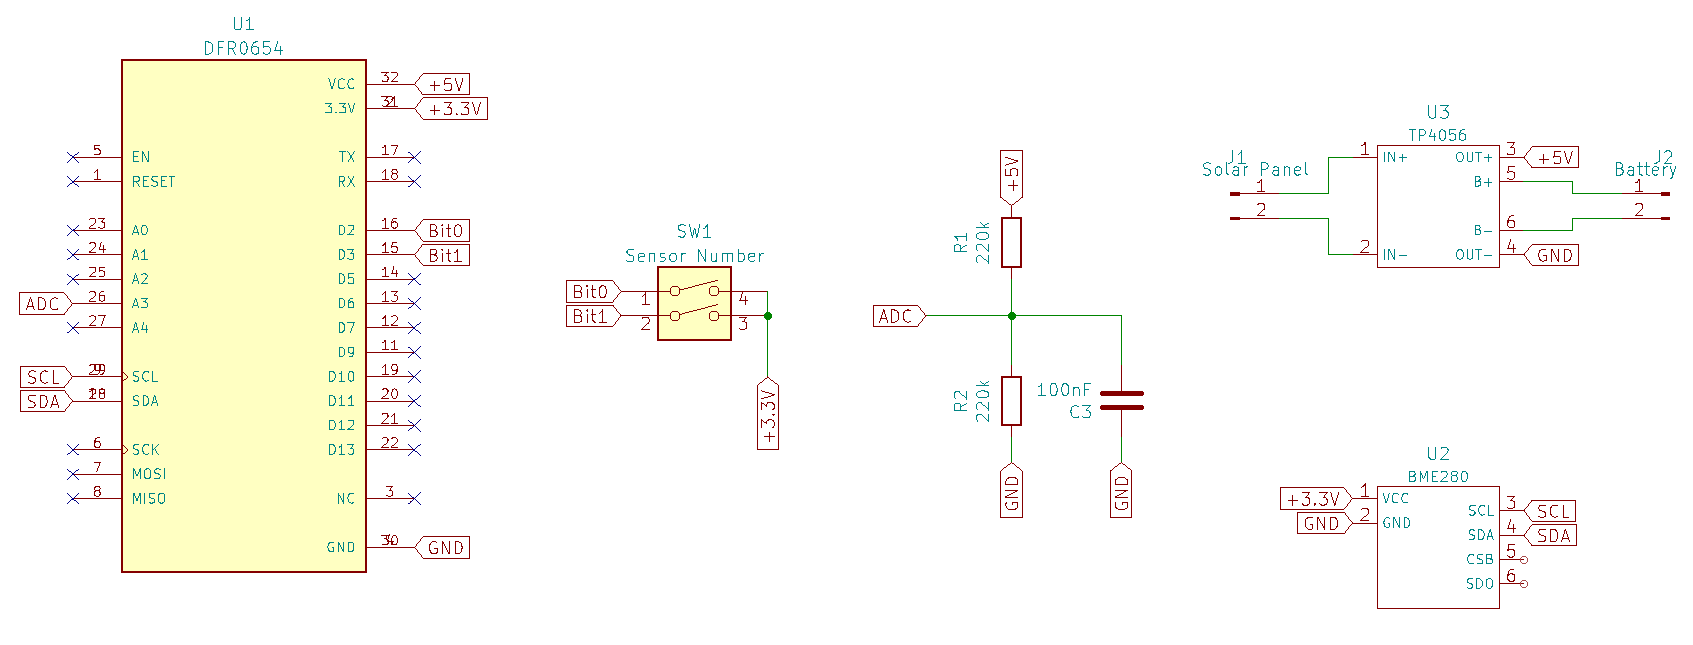
The circuit for the sensor module is very simple. It basically only consists of the connections of the individual modules. In addition, a voltage divider is integrated, with which the ESP32 can measure the current voltage. A DIP switch is used to assign a number to the sensor, which in turn controls the display on the base station.
The entire electronic system requires about 200 mA in active mode and about 20 µA in deep sleep mode, as described above. A cycle between waking up, sending data and going back into deep sleep mode takes about 10 seconds. During this time, 10s x 200mA + 600s x 0.02mA = 2012mAs are consumed. A full lithium-ion battery has an average capacity of 2000 mAh or 7200000 mAs. Dividing the two values gives 7200000 / 2012 = 3578 cycles. With a cycle length of 610s, that is 3578 x 610s = 2182580s, which in turn is about 25 days. It remains to be seen in the course of the winter whether these are enough reserves to get through the dark winter days.
A KiCad project with the circuit and the board layout is available on GitHub.
Unfortunately, designing my own ESP32 board is beyond my capabilities. Basically, the board would be very similar to the Firebeetle, except that the power supply via a solar cell would have to be solved differently. I would be very happy about support here, as the sensor could become much more compact.
Software
The code for the sensor is written in C using the ESP-IDF framework from Espressif. The following diagram shows the sequence between waking up and returning to deep sleep mode:
The driver for the Bosch BME280 is quite easy to implement, as there is already a generic library from Bosch on GitHub. You only have to take care of the specific I2C interface. Besides the BME280, I also implemented a driver for the HDC1080 from Texas Instruments. However, the values for humidity are clearly too high, so I will not use this sensor. Possibly the sensor is defective or my code is just not correct yet.
The driver must implement the following functions::
esp_err_t sensor_driver_init_sensor(sensor_driver_t *handle){
    return handle->init_sensor(handle);
}
esp_err_t sensor_driver_read_values(sensor_driver_t *handle, sensor_data_t *values){
    return handle->read_values(handle, values);
}
void sensor_driver_get_json(sensor_driver_t *handle, sensor_data_t values, char* message){
    return handle->get_json(handle, values, message);
}
Each driver delivers the values that it can measure. These values are collected and sent to the MQTT broker in JSON format. For two sensors, this looks like this:
{
   "battery":3920,
   "wifi":-65,
   "sensors":{
      "hdc1080":{
         "temperature":22.388611,
         "humidity":56.036377
      },
      "bme280":{
         "temperature":22.365077,
         "humidity":47.958395,
         "pressure":979.601209
      }
   }
}
In this real example, you can see very well the big difference in humidity between the two sensors.
My SmartConfig library is also integrated so that the sensor can be easily connected to the Wi-Fi network. With the help of a smartphone, all sensors are configured in a few seconds and can connect to the wireless network.
The code for the sensor module is on GitHub.
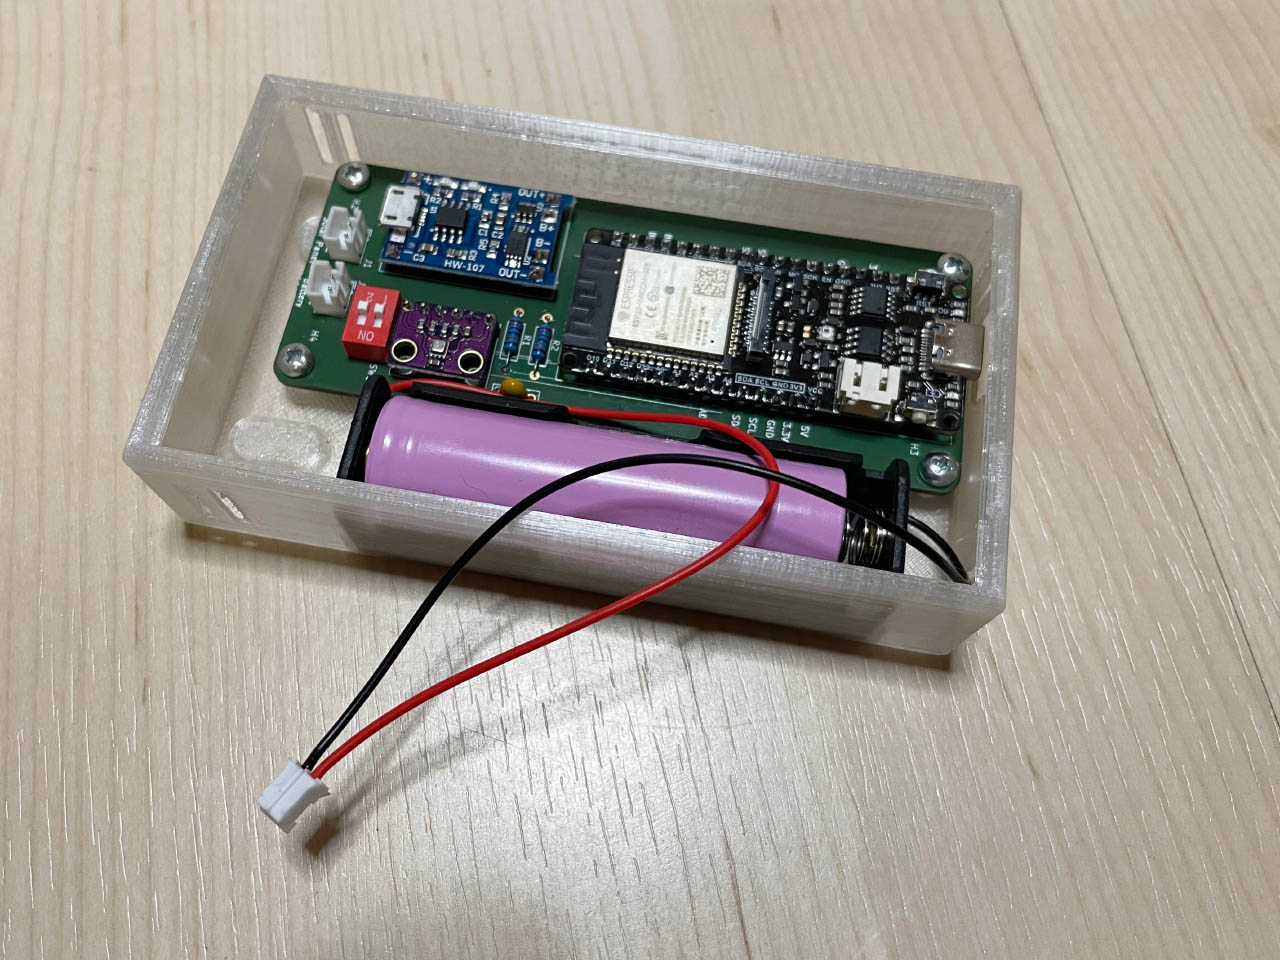
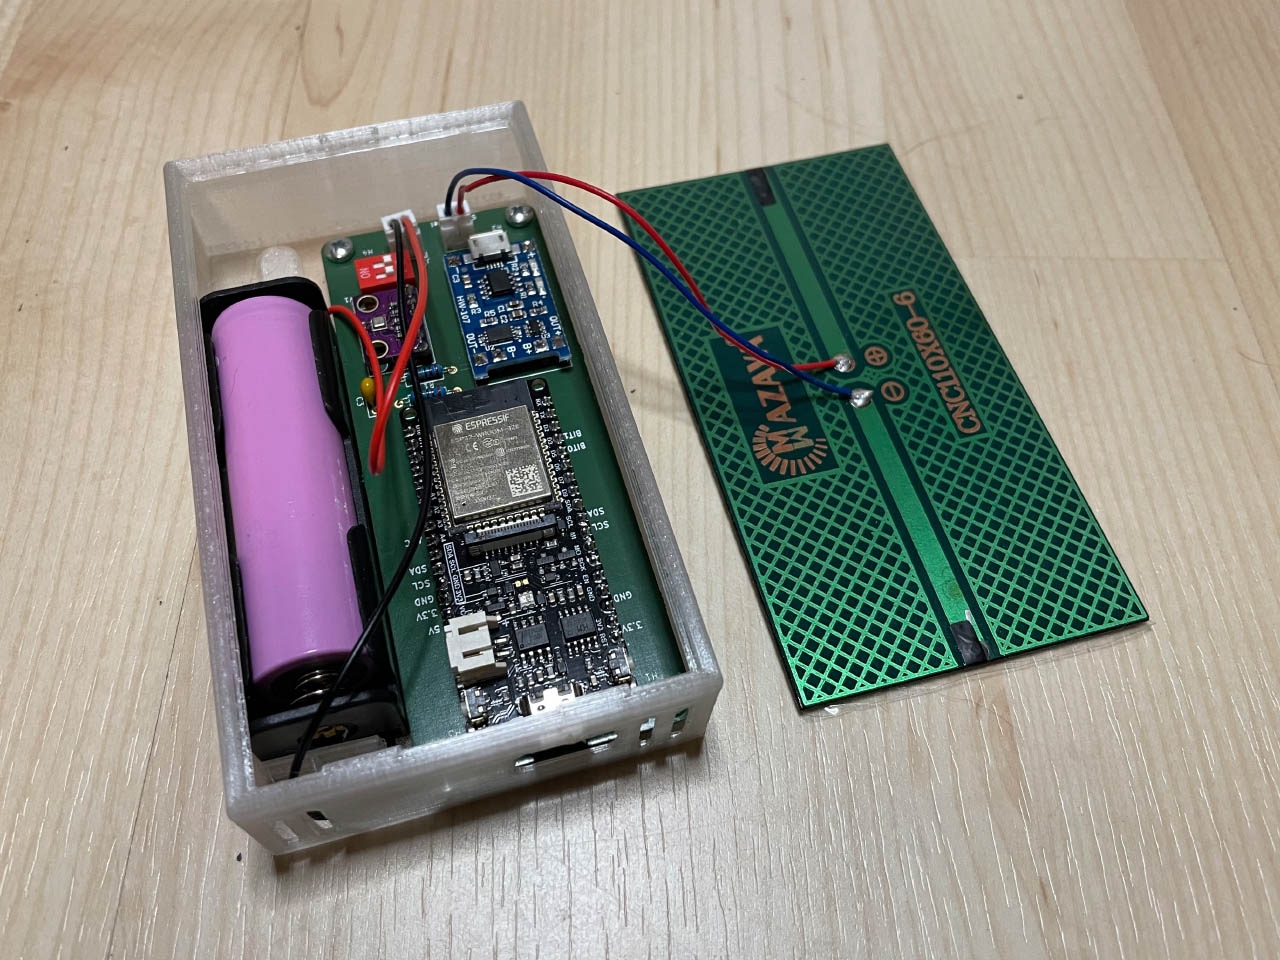
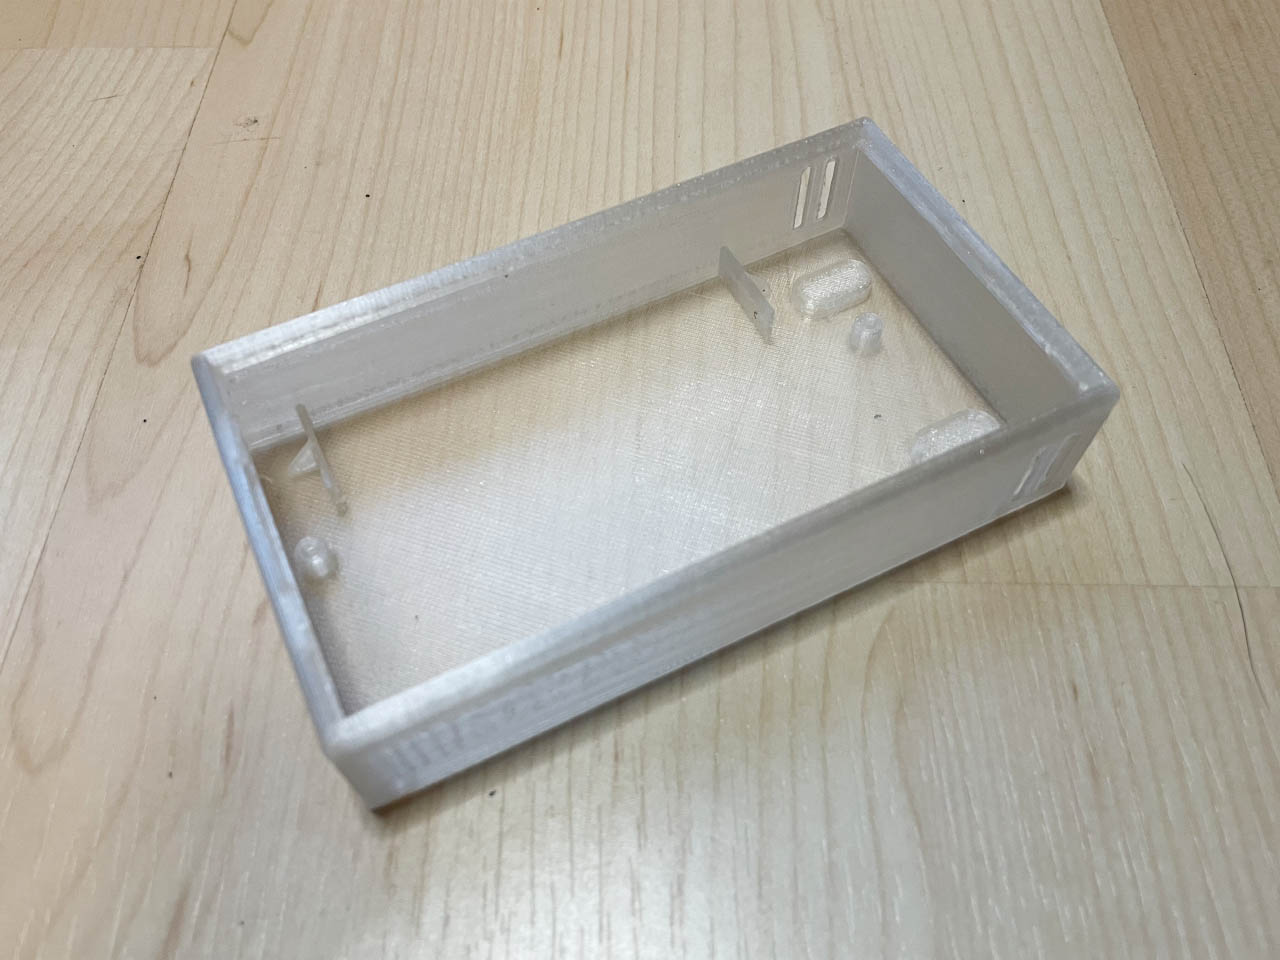
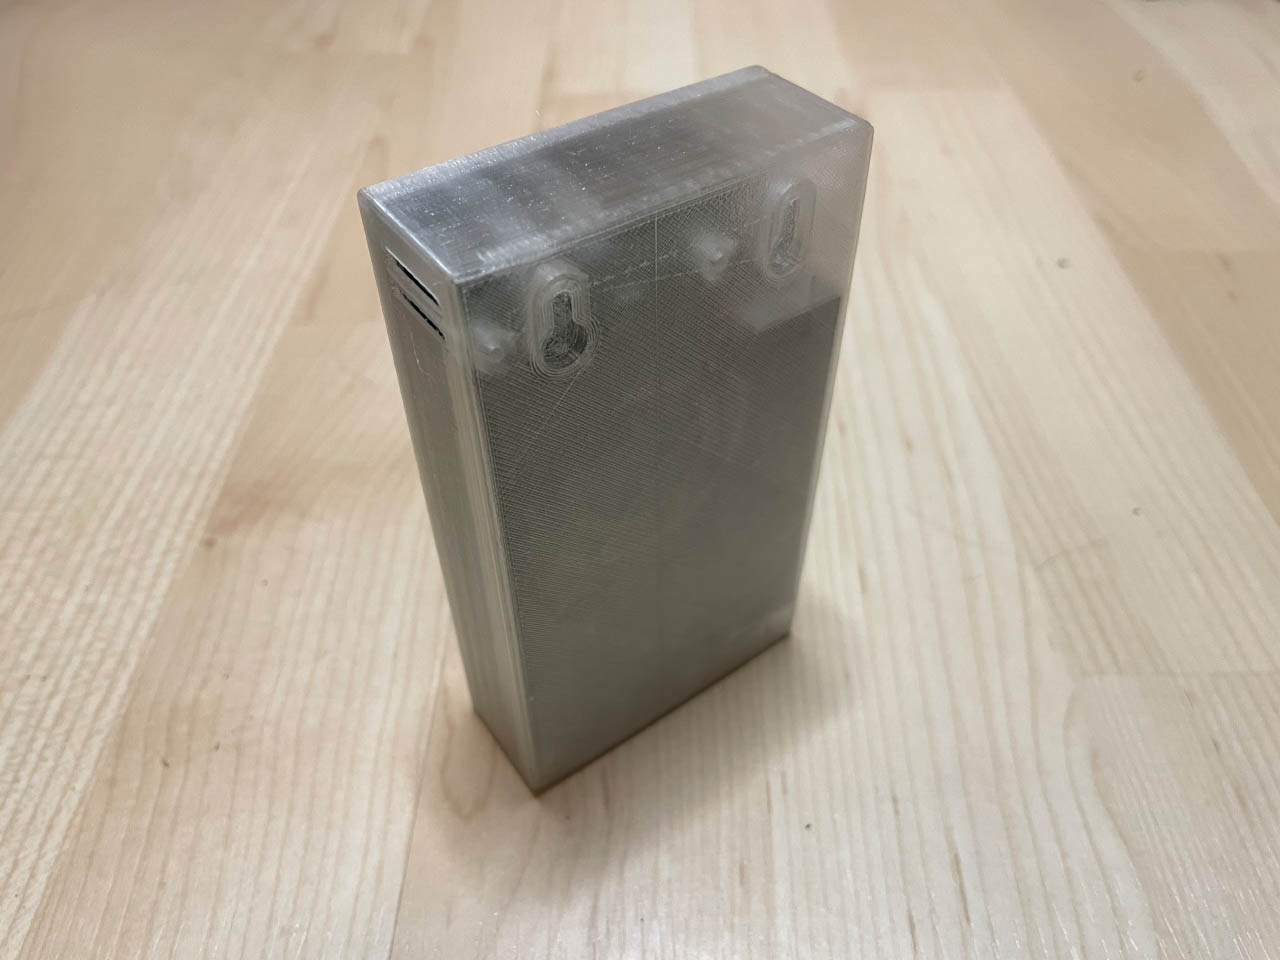
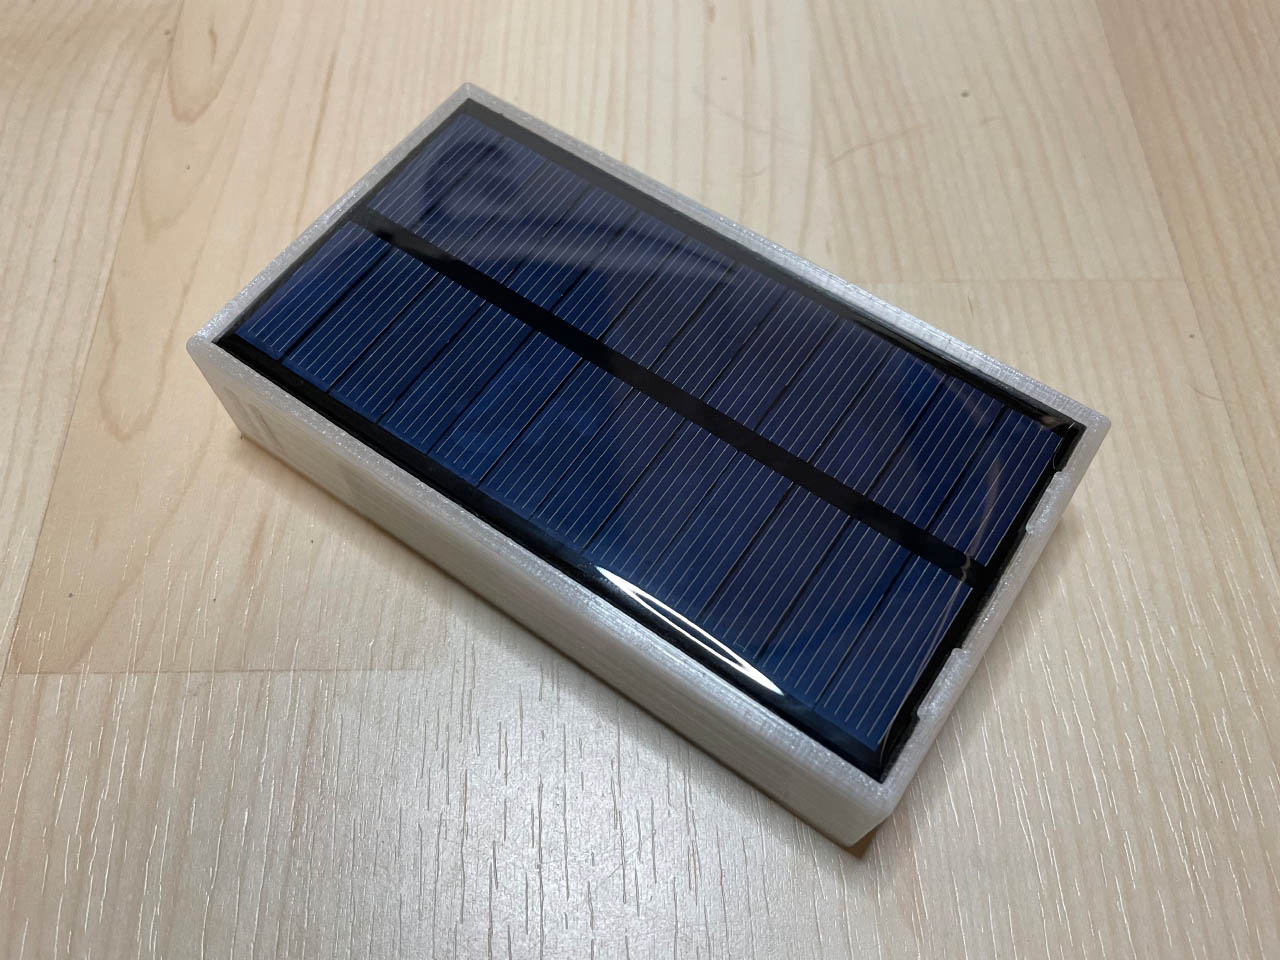
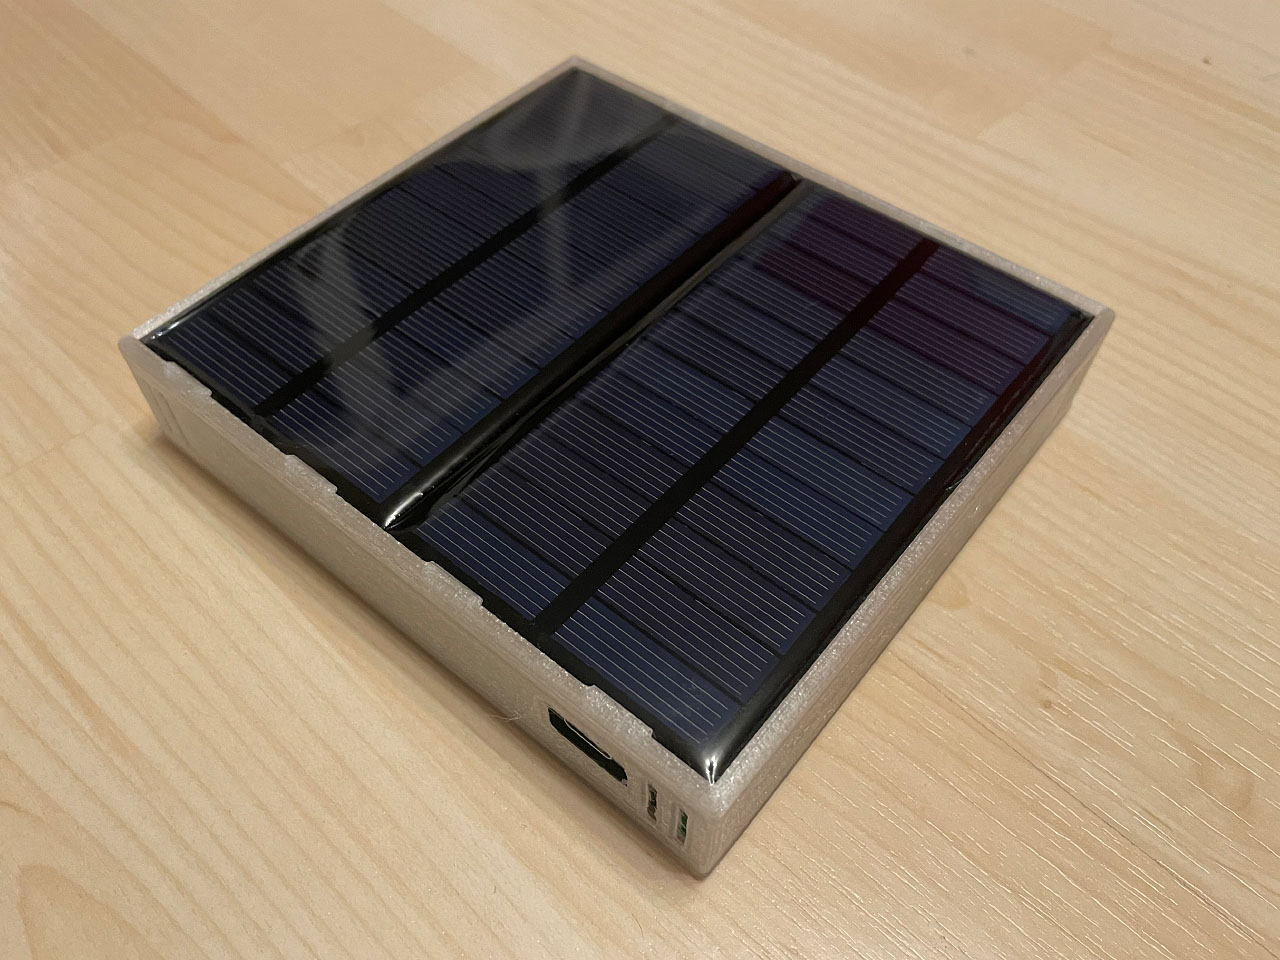
Case for the sensor module
Of course, the sensor module also needs a case. I tried to make the case as compact as possible using a 6 volt/1 watt solar cell. The case is available on GitHub as a STEP file.
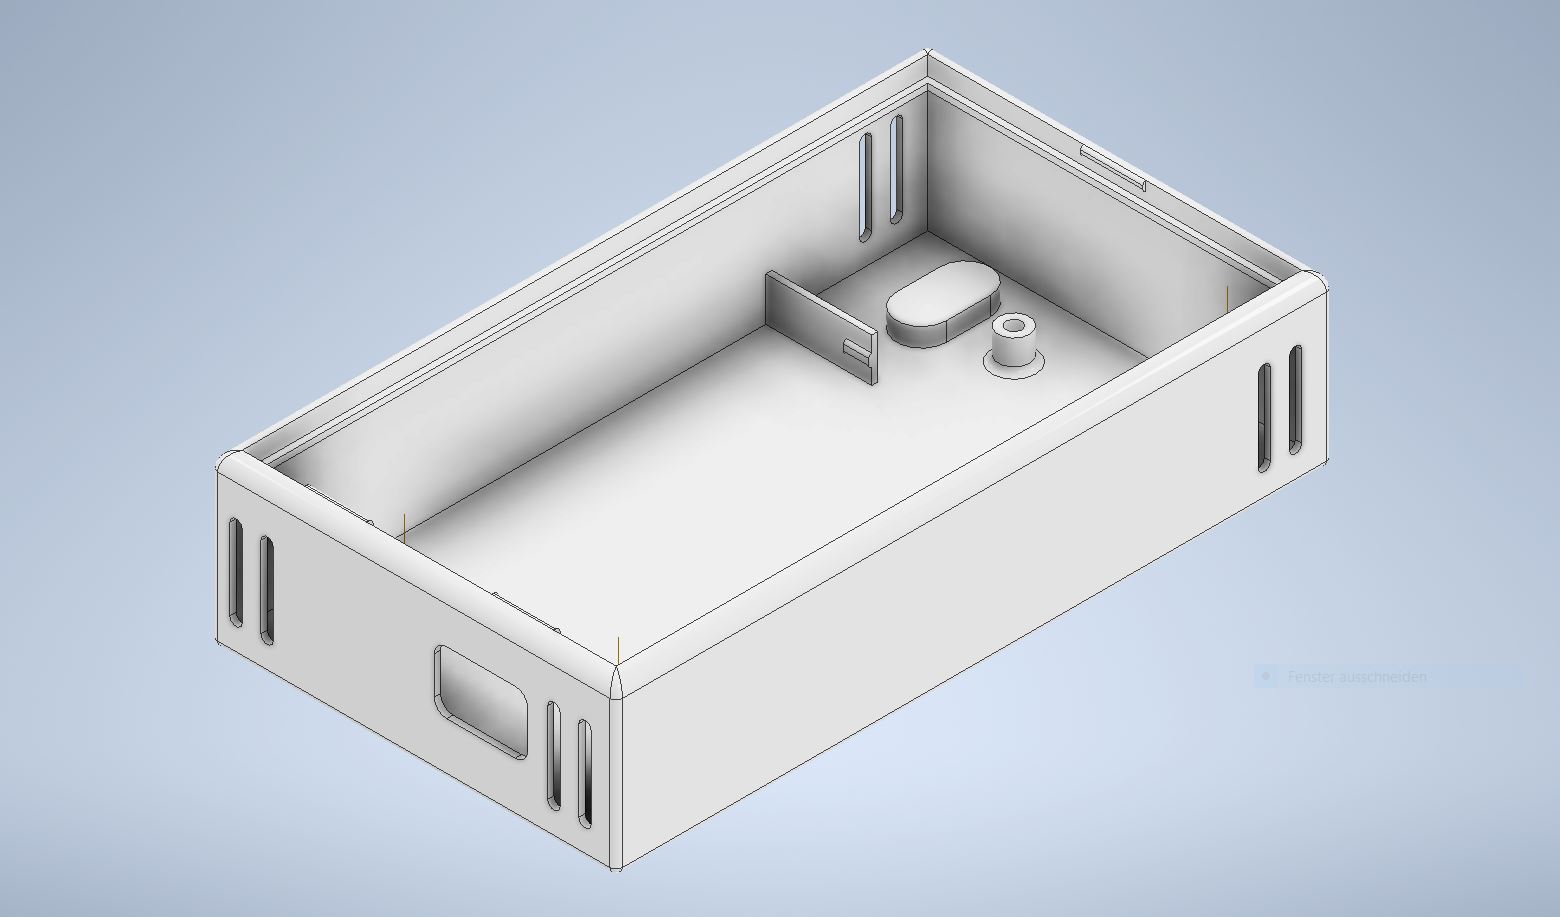
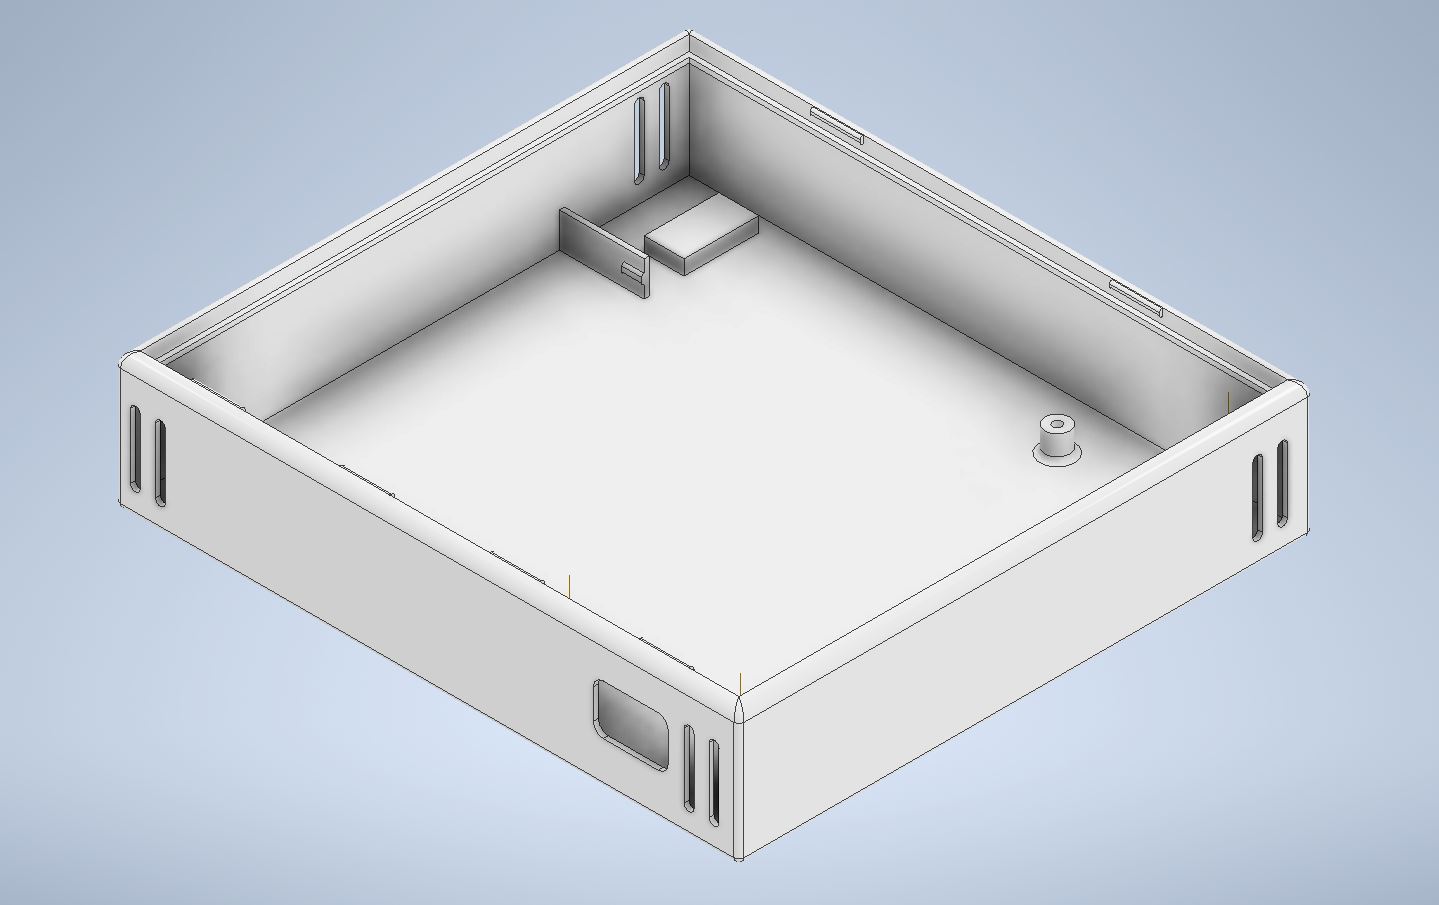
More designs with more solar cells will follow so that the sensor also has enough power in darker rooms. As soon as they are ready, I will update the post accordingly.
Possible enhancements
The weather station works and also meets all my expectations. But that doesn't mean that the development is finished. Spontaneously, I can think of these topics that could still be implemented:
- Replace the sensor module with my own design. But I need help for this, especially with the power supply.
- Implement additional weather API, for example from Tomorrow.io.
- OTA update of the sensors.
- Simple template system to configure the layout of the weather station.
- Integrate additional temperature sensors such as DHT20, HTU21D, etc., but also other sensors for carbon monoxide, air quality, ozone, etc.
- Secure MQTT.
- Setup wizard to set the location and select the WLAN network.
- Automatic brightness control of the display.
- Larger display to show more data.
- Small energy-saving e-paper display in the sensor modules.
I don't know if and when I will implement all the points. But maybe there are a few people out there who are also interested in the topic and want to collaborate. I would be very happy about that!