ESP32 Weather Station with Weather Forecast, Wireless Sensors and Air Quality Measurement
In this article, I would like to introduce to you my new weather station with some very interesting new features. Since the last version based on the Raspberry Pi, all components have been newly developed and now rely on the ESP32 microcontroller. Once again, the entire setup is open-source, and relevant references will be provided at the respective locations.
The following list shows the most important features of the ESP32 weather station:
- Base station with ESP32-S3 and 7-inch display
- Self-developed wireless sensor based on ESP32
- Battery of the wireless sensors charged via solar cells
- Very low power consumption of the wireless sensors thanks to the ESP-NOW protocol
- Up to 8 wireless sensors easily configurable via DIP switch
- Wireless sensors automatically connect to the base station
- Each wireless sensor measures temperature, humidity, and air pressure
- The base station provides temperature, humidity, VOC index, particulate matter, NOₓ, and CO₂ levels
- Detailed weather forecast through a free API for the next 48 hours and 7 days
- The display adjusts its brightness automatically based on the surrounding environment
- Professional appearance with a 3D-printed casing
The weather station has been operational for a few weeks now, so I would like to introduce the project here and describe the individual components in detail.
The construction guide is divided into the following sections:
- The functioning of the weather station
- The environmental sensors used
- OpenWeather API
- The base station
- Wireless sensors
- Conclusion
How the weather station works
The weather station consists of two central components. The base station with the display for showing all the data and the sensors that regularly send the values for temperature, humidity, and air pressure. Additionally, environmental sensors are located within the base station to measure air quality. The following diagram illustrates the structure and demonstrates how the components communicate with each other:
The very fast ESP-NOW protocol is used to transmit data from the wireless sensors. The communication of the environmental sensors with the ESP32 microcontrollers is done via the I2C protocol. A DIP switch is used to assign a number to each wireless sensor so that the individual modules can be uniquely identified. The wireless sensors are each powered by an 18650 lithium-ion battery, which is charged by 6 volt solar cells. Weather forecast data is retrieved via Wi-Fi every 10 minutes using a free API. Currently I use the API from OpenWeatherMap for this, but any other API could be used.
The environmental sensors used
The most important components of the weather station are the environmental sensors. However, the choice of suitable sensors is difficult, since the selection is very large and the accuracy sometimes leaves much to be desired, especially with cheap sensors from Chinese production. Besides quality, the availability of ESP32 libraries was also very important, as the development of such drivers can be very time consuming. I finally decided to use sensors from Bosch Sensortec and Sensirion, which I would like to introduce briefly here.
Bosch Sensortec BME280
The BME280 is an environmental sensor specially developed for mobile applications by Bosch Sensortec. It is used to measure humidity, air pressure and temperature. The sensor is based on MEMS (Micro-Electro-Mechanical Systems) technology, which ensures high precision and long-term stability of the measurements.
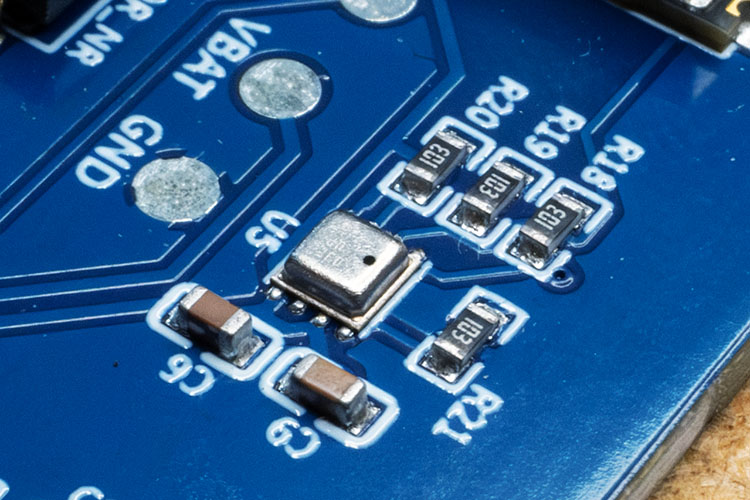
The BME280 can communicate via an I2C or SPI interface, which facilitates integration into various projects. Thanks to its low power consumption, it is particularly suitable for battery-powered applications. One disadvantage of the BME280 is that it heats up a bit in continuous operation, which can falsify the temperature value. However, since it only provides a value every 10 minutes on the wireless sensors, this does not matter for the weather station.
The following block diagram shows the structure of the sensor:
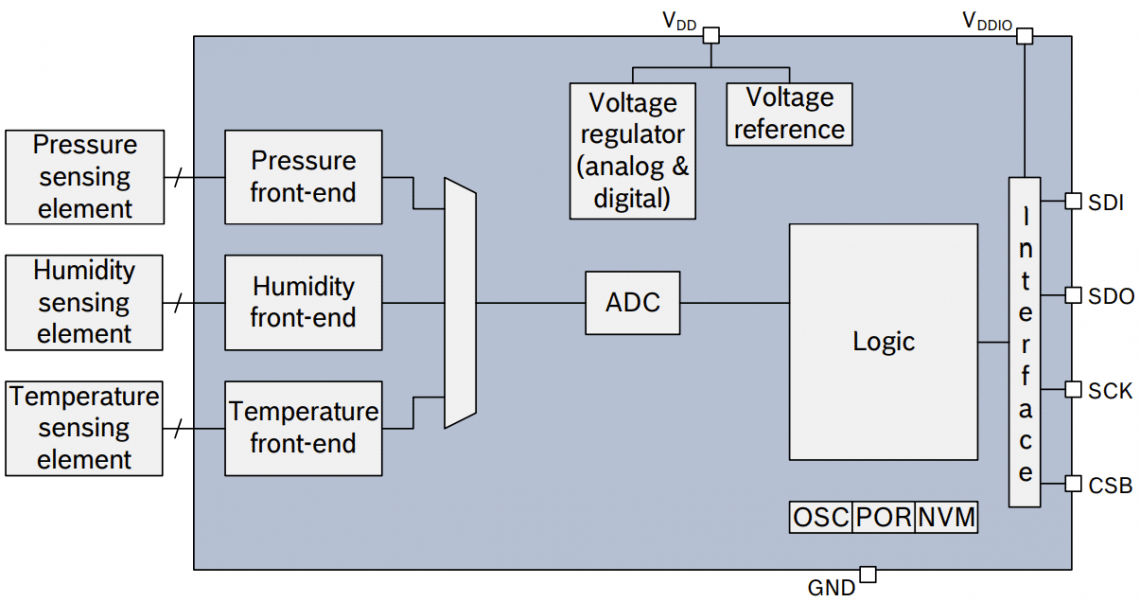
Some important key data of the BME280:
| Supply voltage: | 1.71 V to 3.6 V |
| Power consumption: | 1.8 µA @ 1 Hz humidity and temperature 2.8 µA @ 1 Hz pressure and temperature 3.6 µA @ 1 Hz humidity, pressure and temperature 0.1 µA in sleep mode |
| Measuring range: | -40 °C to +85 °C 0 to 100 % rel. humidity 300 to 1100 hPa |
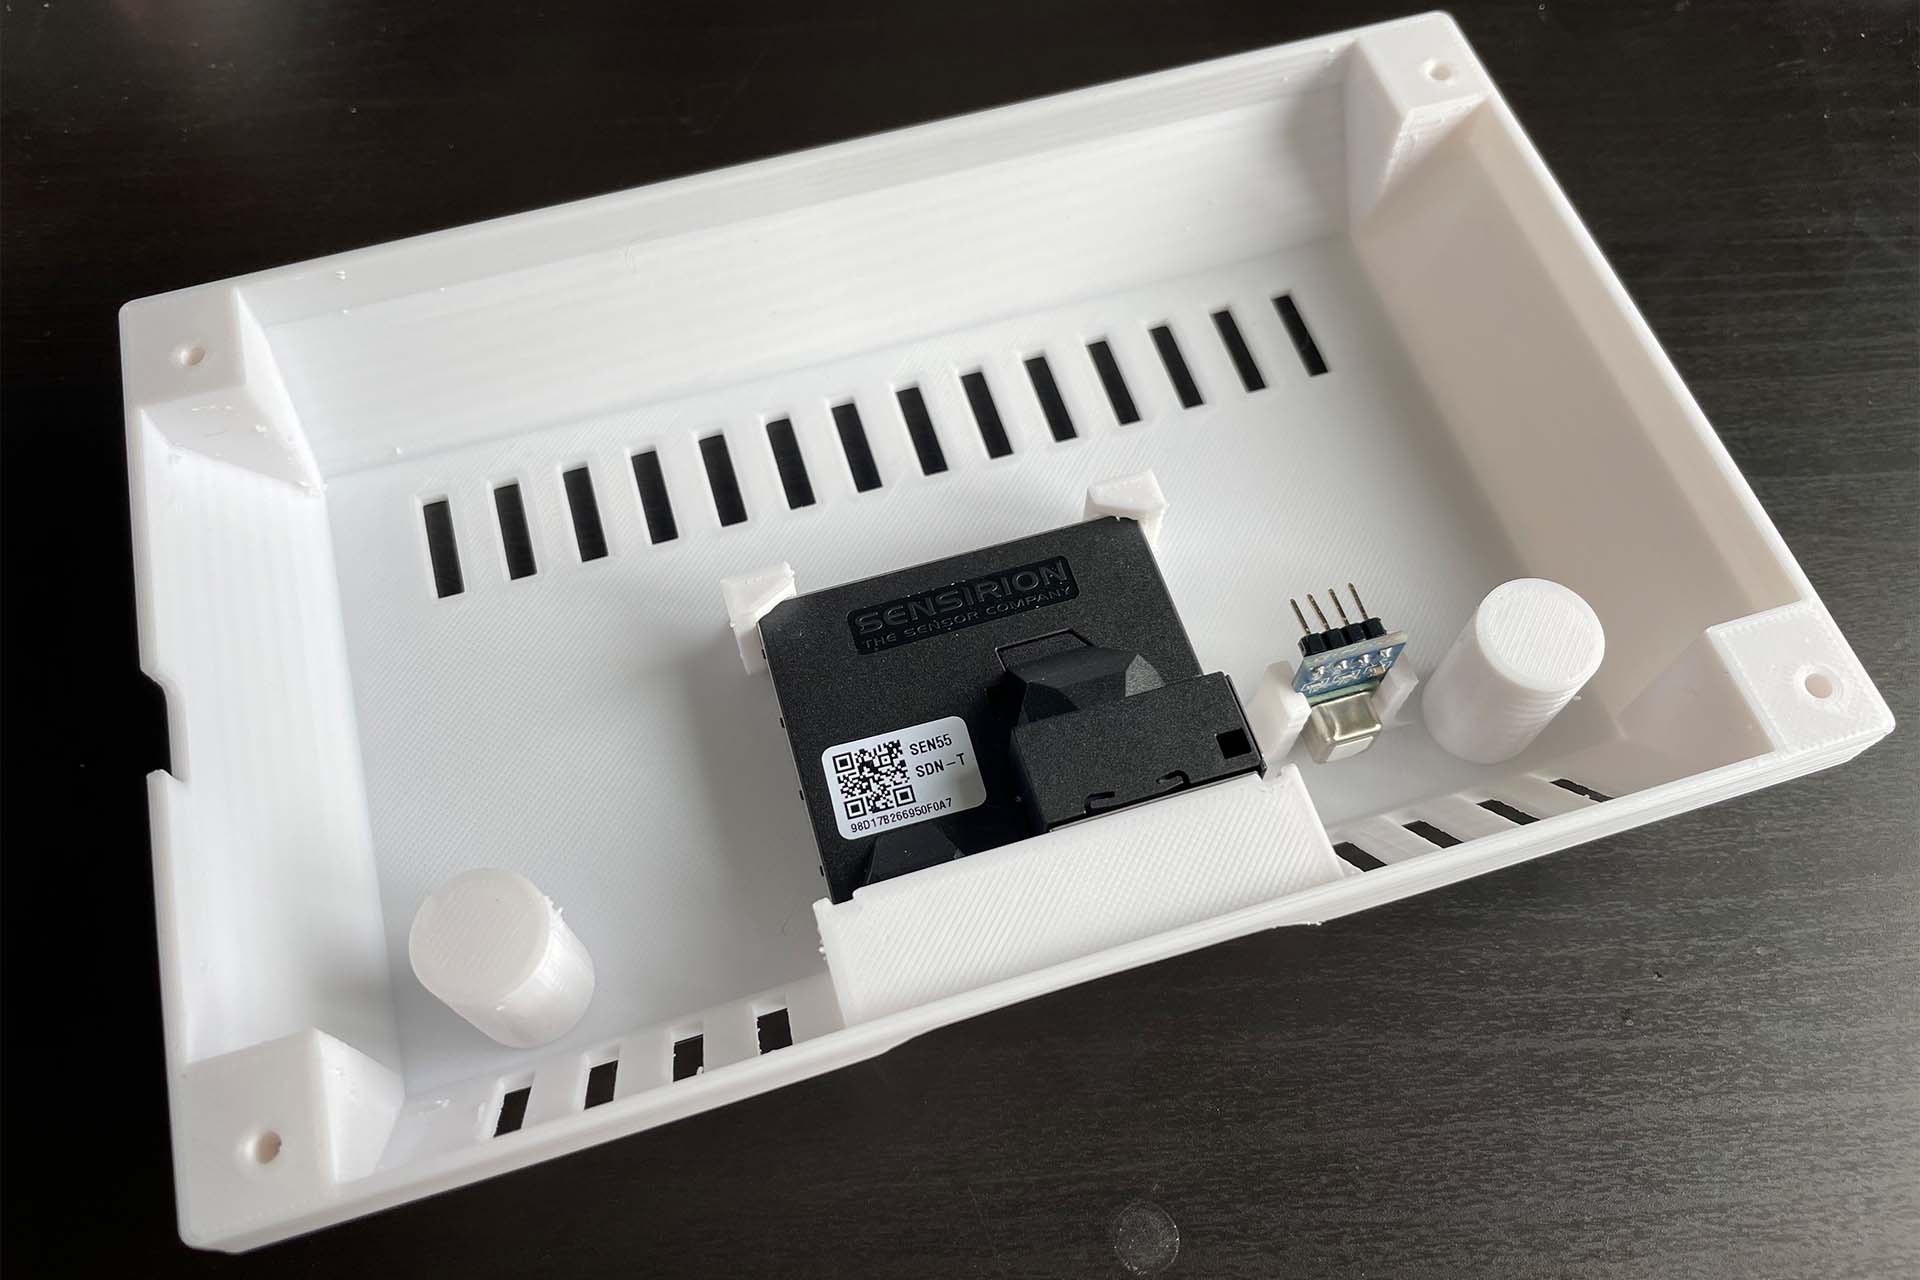
Sensirion SEN55
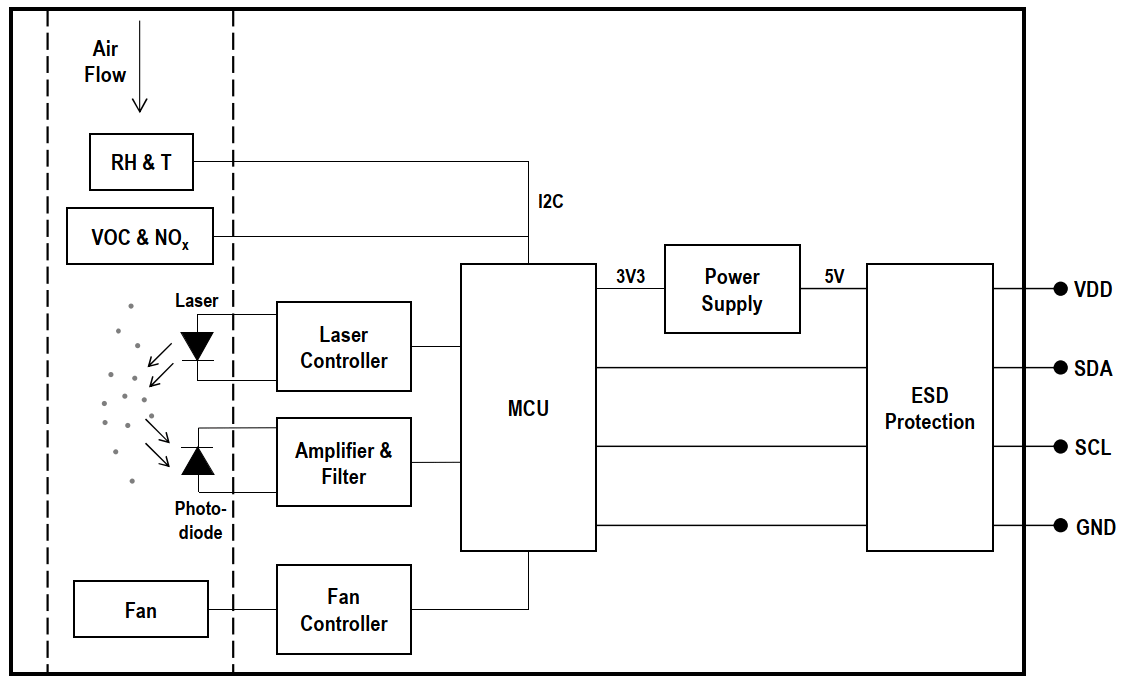
Sensirion's SEN55 is a highly accurate environmental sensor that can measure particulate matter, volatile organic compounds (VOCs), nitrogen oxides (NOx), relative humidity and temperature. The particulate sensor uses laser-based technology to measure particles in the PM1, PM2.5, PM4 and PM10 categories. The NOx and VOC sensor are based on Metal Oxide Gas sensors (MOX). Communication with the sensor is via an I2C interface.
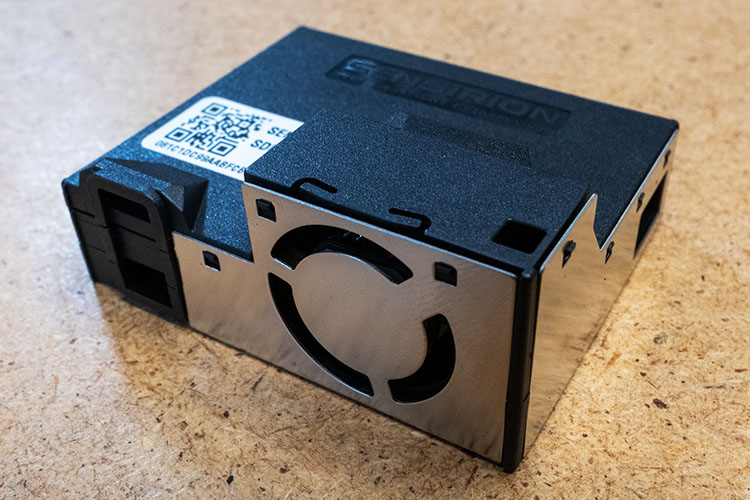
The wide range of parameters that the SEN55 sensor can measure makes it particularly suitable for monitoring the quality of indoor air. Especially the wide range of fine dust measurement can register a variety of particles in the ambient air. The following overview shows some examples of fine dust particles and their size:
The structure of the SEN55 is as follows:
Some important key data of the SEN55:
| Supply voltage: | 4.5 V to 5.5 V | |
| Power consumption: | Average 63 mA Maximum 110 mA |
|
| Measuring range: | Temperature +10 °C to +40 °C Humidity 20 % to 80 % Particles 0 to 1000 μg/m3 |
|
| Lifetime | > 10 years |
Sensirion SCD41
The SCD41 is a high-precision CO2 sensor from Sensirion. It is designed to provide accurate measurements of carbon dioxide concentration in ambient air. The sensor is based on NDIR (Non-Dispersive Infrared) technology, which measures the absorption of infrared light in a gas.
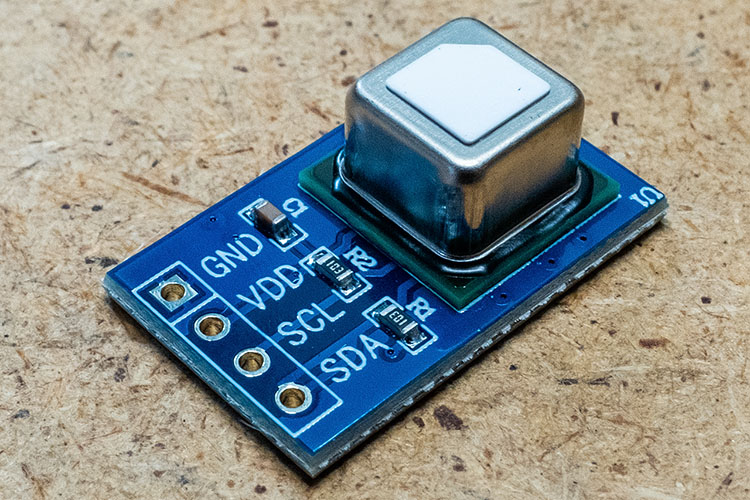
The accuracy of the measurement also depends on factors such as temperature and humidity, so the SCD41 also contains a humidity and temperature sensor to compensate for such deviations. Communication takes place via an I2C interface.
The following block diagram shows the structure of the sensor:
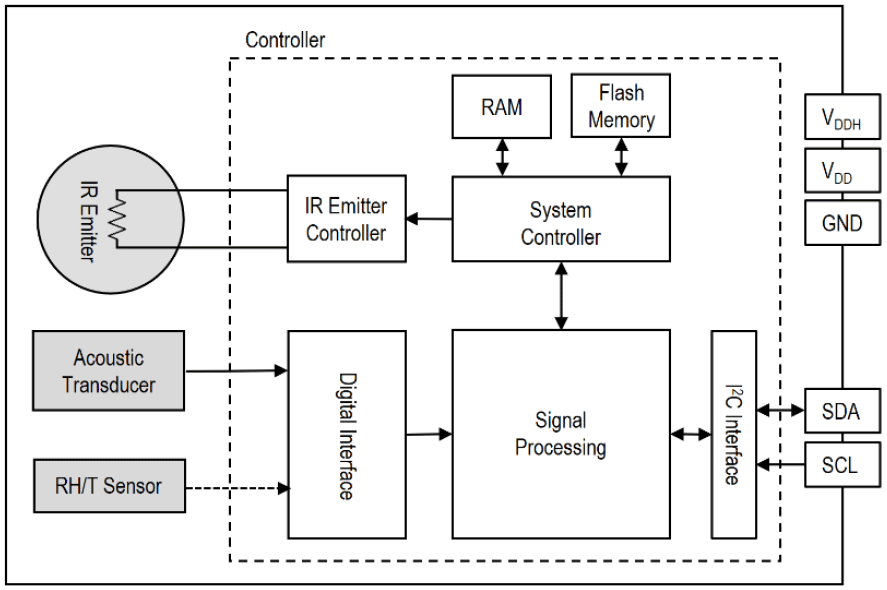
Some important key data of the SCD41:
| Supply voltage: | 2.4 V bis 5.5 V |
| Power consumption: | Average 15 mA Maximum 205 mA |
| Measuring range: | 400 to 5000 ppm |
OpenWeather API
Besides the values of the sensors, the weather station needs the data for the weather forecast. For this I use the API of OpenWeatherMap again. How to get an OpenWeather API account, I have already explained in detail in the article about the Raspberry Pi weather station. In the meantime I also took a closer look at the APIs of Tomorrow.io and Open-Meteo, but I haven't found a good reason to change the API yet. OpenWeatherMap's weather forecast occasionally changes its mind, especially for anything more than 3 days in the future, but it's definitely enough for a rough overview. Maybe someone here has some experience how it is with other weather APIs? All in all, I'm very happy with OpenWeatherMap and since I'm far below the 1000 calls per day, using it hasn't cost me anything so far.
To simplify reading the weather data, I wrote an OpenWeatherData class in C++ that parses the JSON string and writes the lists and values to appropriate variables. The call of the API then looks like this:
HTTPClient http;

String openweather_url = "https://api.openweathermap.org/data/3.0/onecall";
String openweather_lat = "48.2xxx";
String openweather_lon = "16.3xxx";
String openweather_units = "metric";
String openweather_lang = "de";
String openweather_appid = "xxx";

String apiURL = openweather_url + "?lat=" + openweather_lat + "&lon=" + openweather_lon + "&units=" + openweather_units + "&lang=" + openweather_lang + "&appid=" + openweather_appid;

http.begin(apiURL);
int httpResponseCode = http.GET();

if (httpResponseCode == HTTP_CODE_OK) {
  BasicJsonDocument<SpiRamAllocator> doc(65536);
  DeserializationError error = deserializeJson(doc, http.getStream());

  if (error) {
    log_e("deserializeJson() failed: %s", error.c_str());
  }
  else {
    JsonObject root = doc.as<JsonObject>();

    OpenWeatherData data = OpenWeatherData::from_json(root);

    xSemaphoreTake(mutex, portMAX_DELAY);
    disp_weather(data);
    xSemaphoreGive(mutex);
  }
}

http.end();
For the deserialization of the data ArduinoJson is used, because this library was developed especially for microcontrollers and also supports the PSRAM of the ESP32.
That's all it really takes to use OpenWeatherMap's REST API. Other weather APIs work in the same way and only differ in the amount of data and the JSON structure. So, in principle, it wouldn't be a big effort to switch to another API if there are any advantages to doing so.
The base station
The base station of the weather station was developed from scratch. The Raspberry Pi and the Raspberry 7 inch display were replaced by a much cheaper ESP32 display. The money I saved was used for high quality environmental sensors from Sensirion, so the weather station can display even more interesting data.
Hardware
The central component for the base station is the Sunton ESP32-S3 7 inch display. On the display is an ESP32-S3 microcontroller with 8M PSRAM and 16M Flash. I have already described the basics of this display in an earlier article.
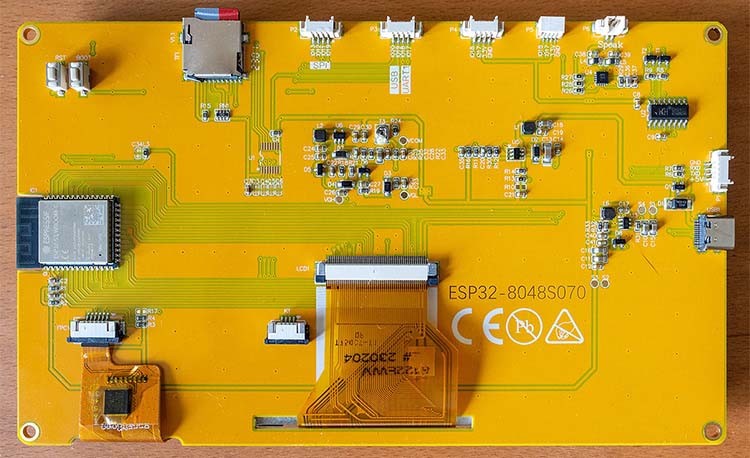
Besides the sensors, only the photoresistor with a voltage divider is needed to control the brightness. The circuit diagram looks like this:
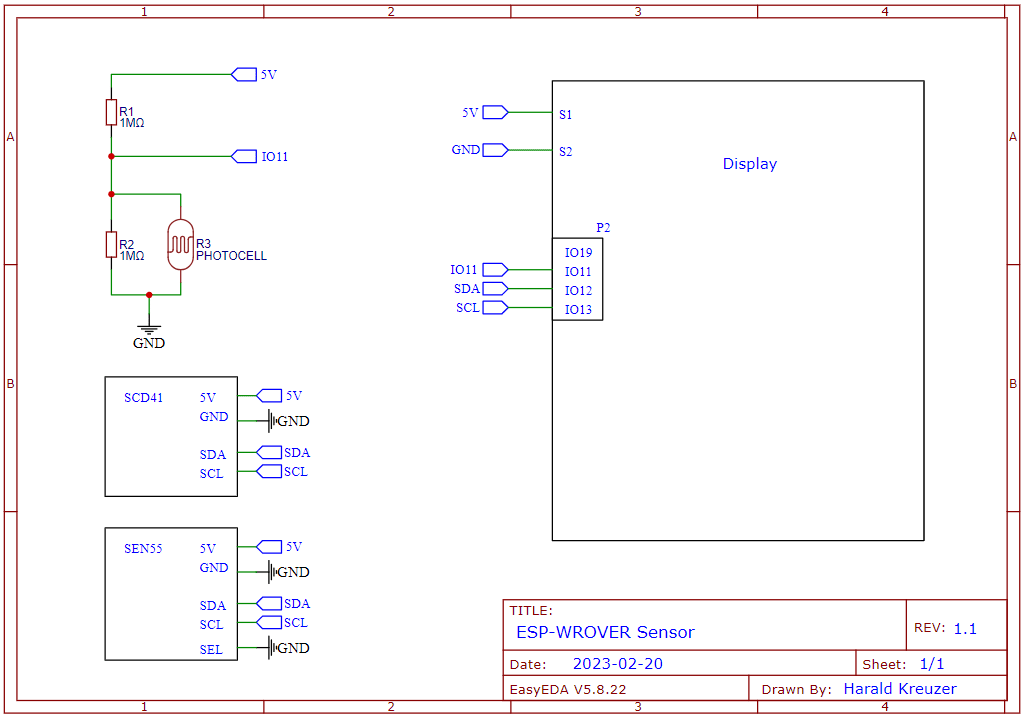
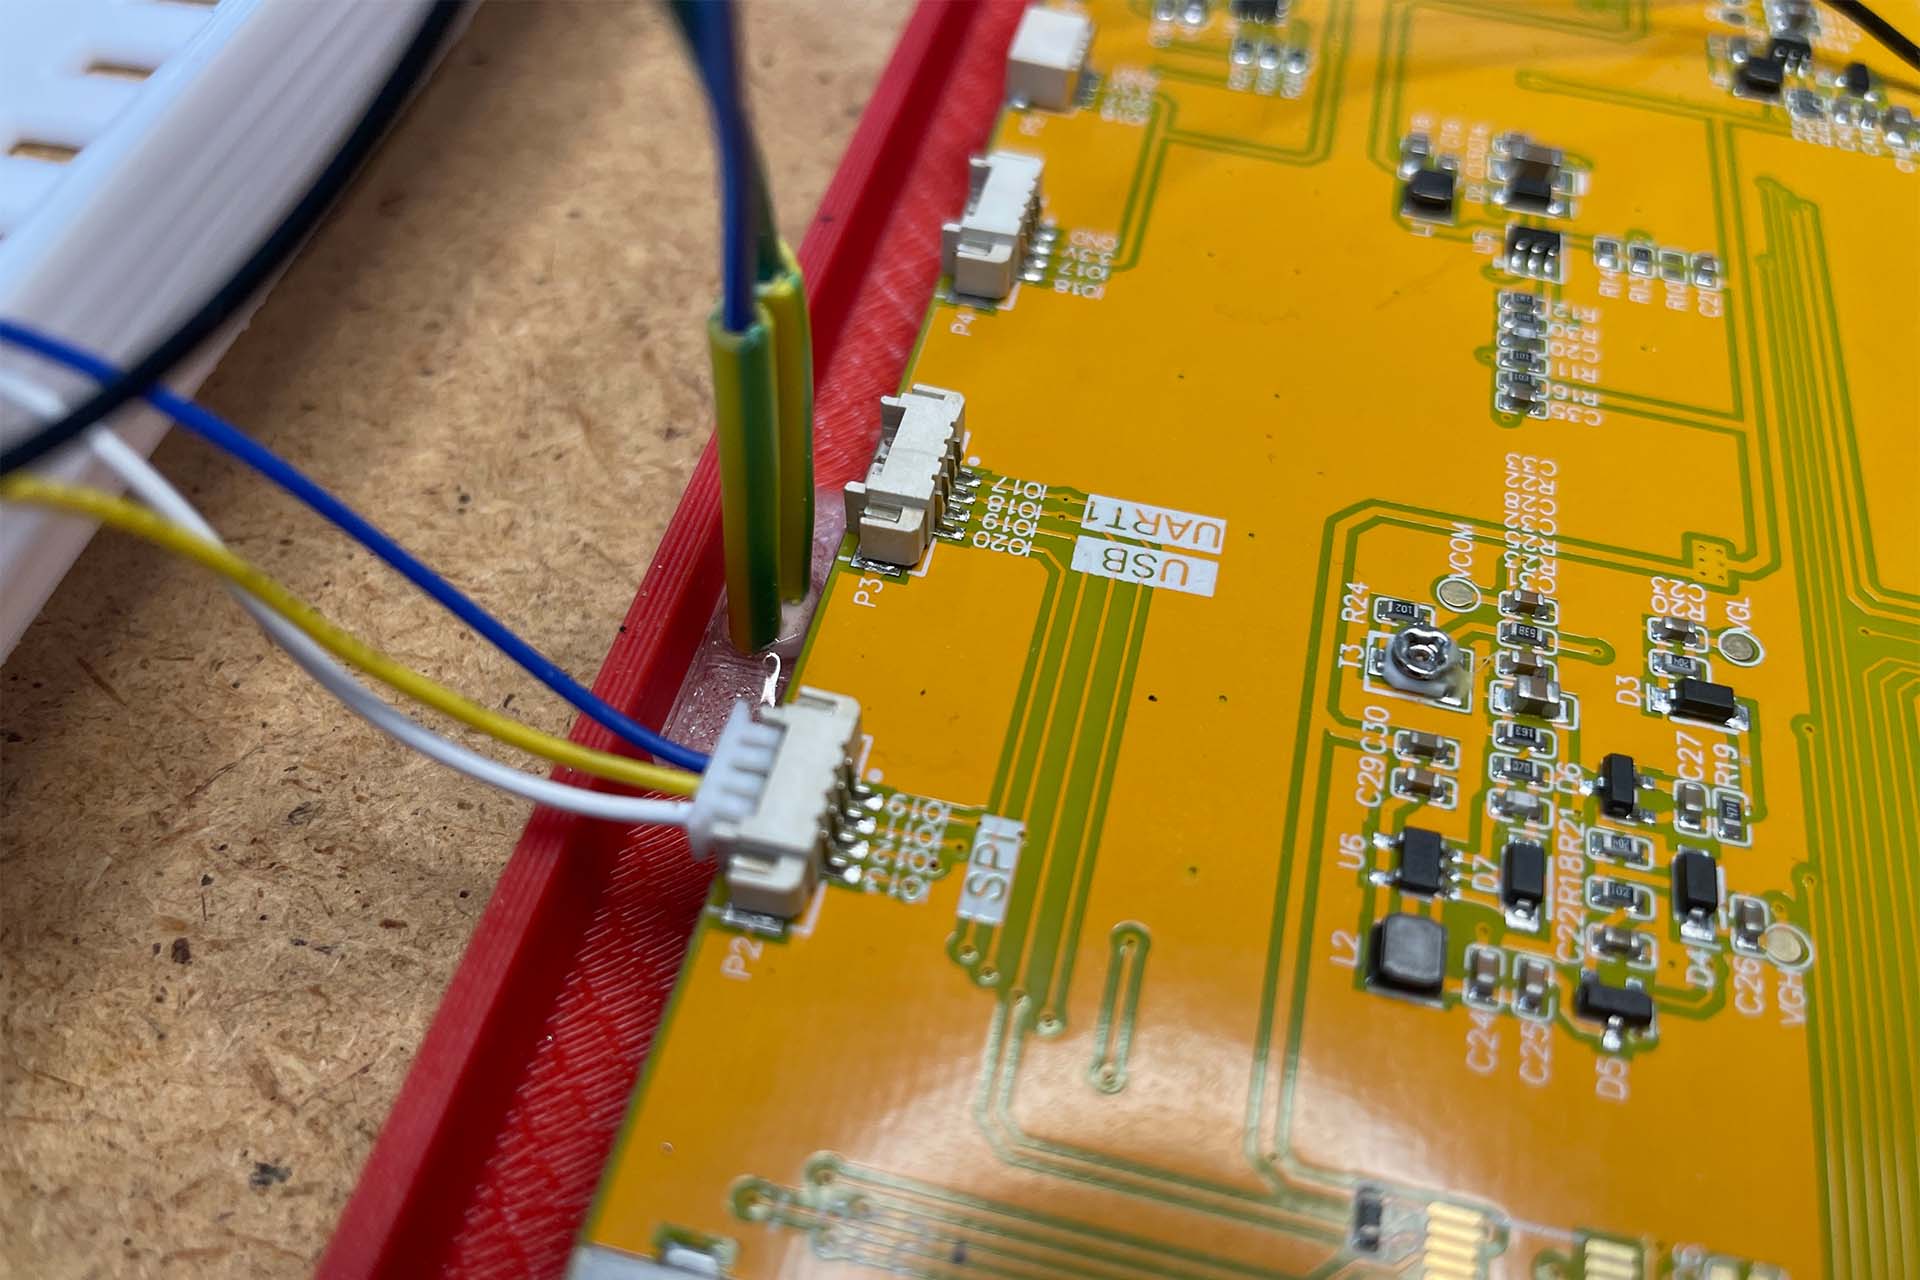
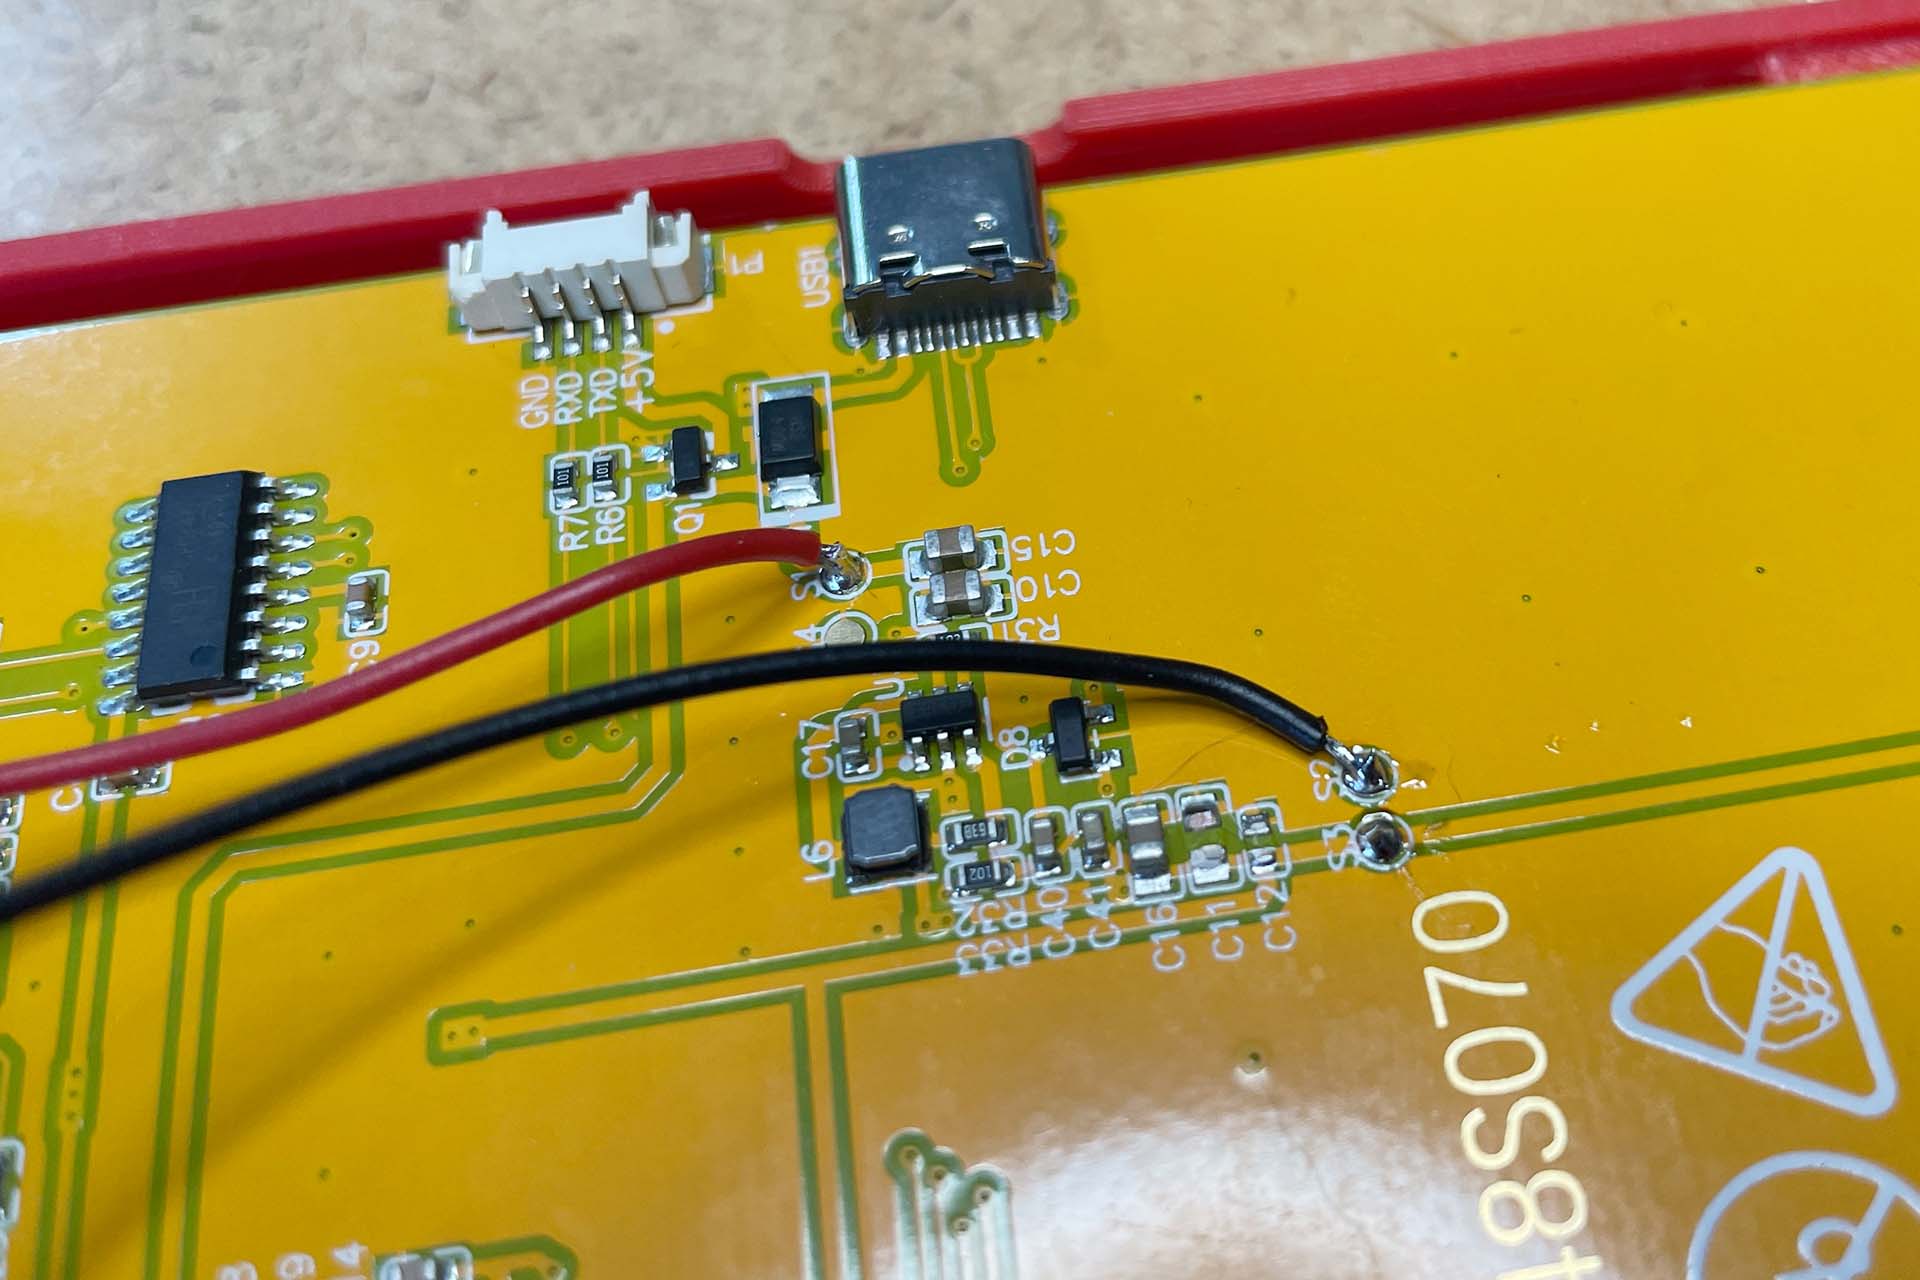
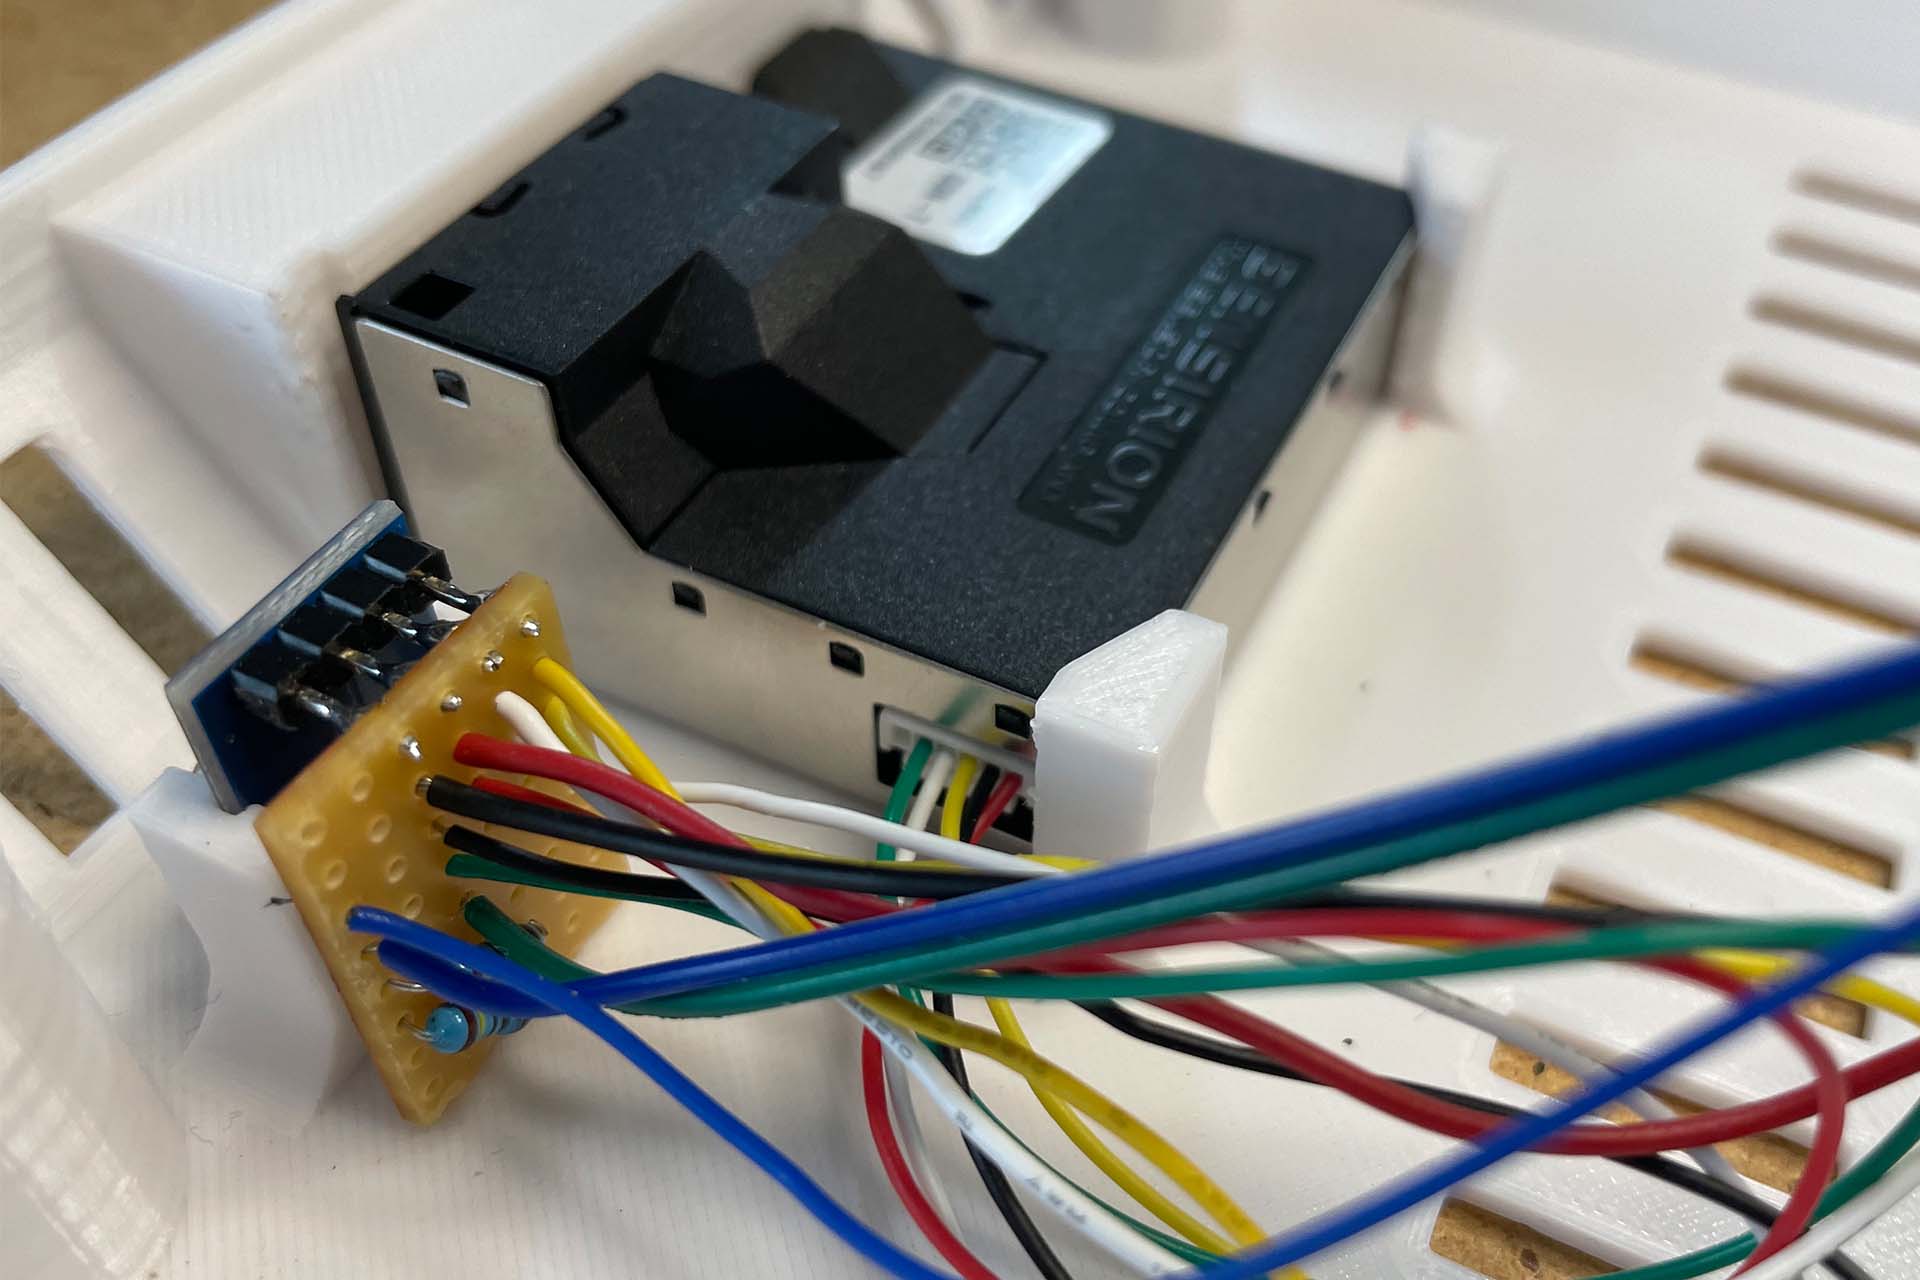
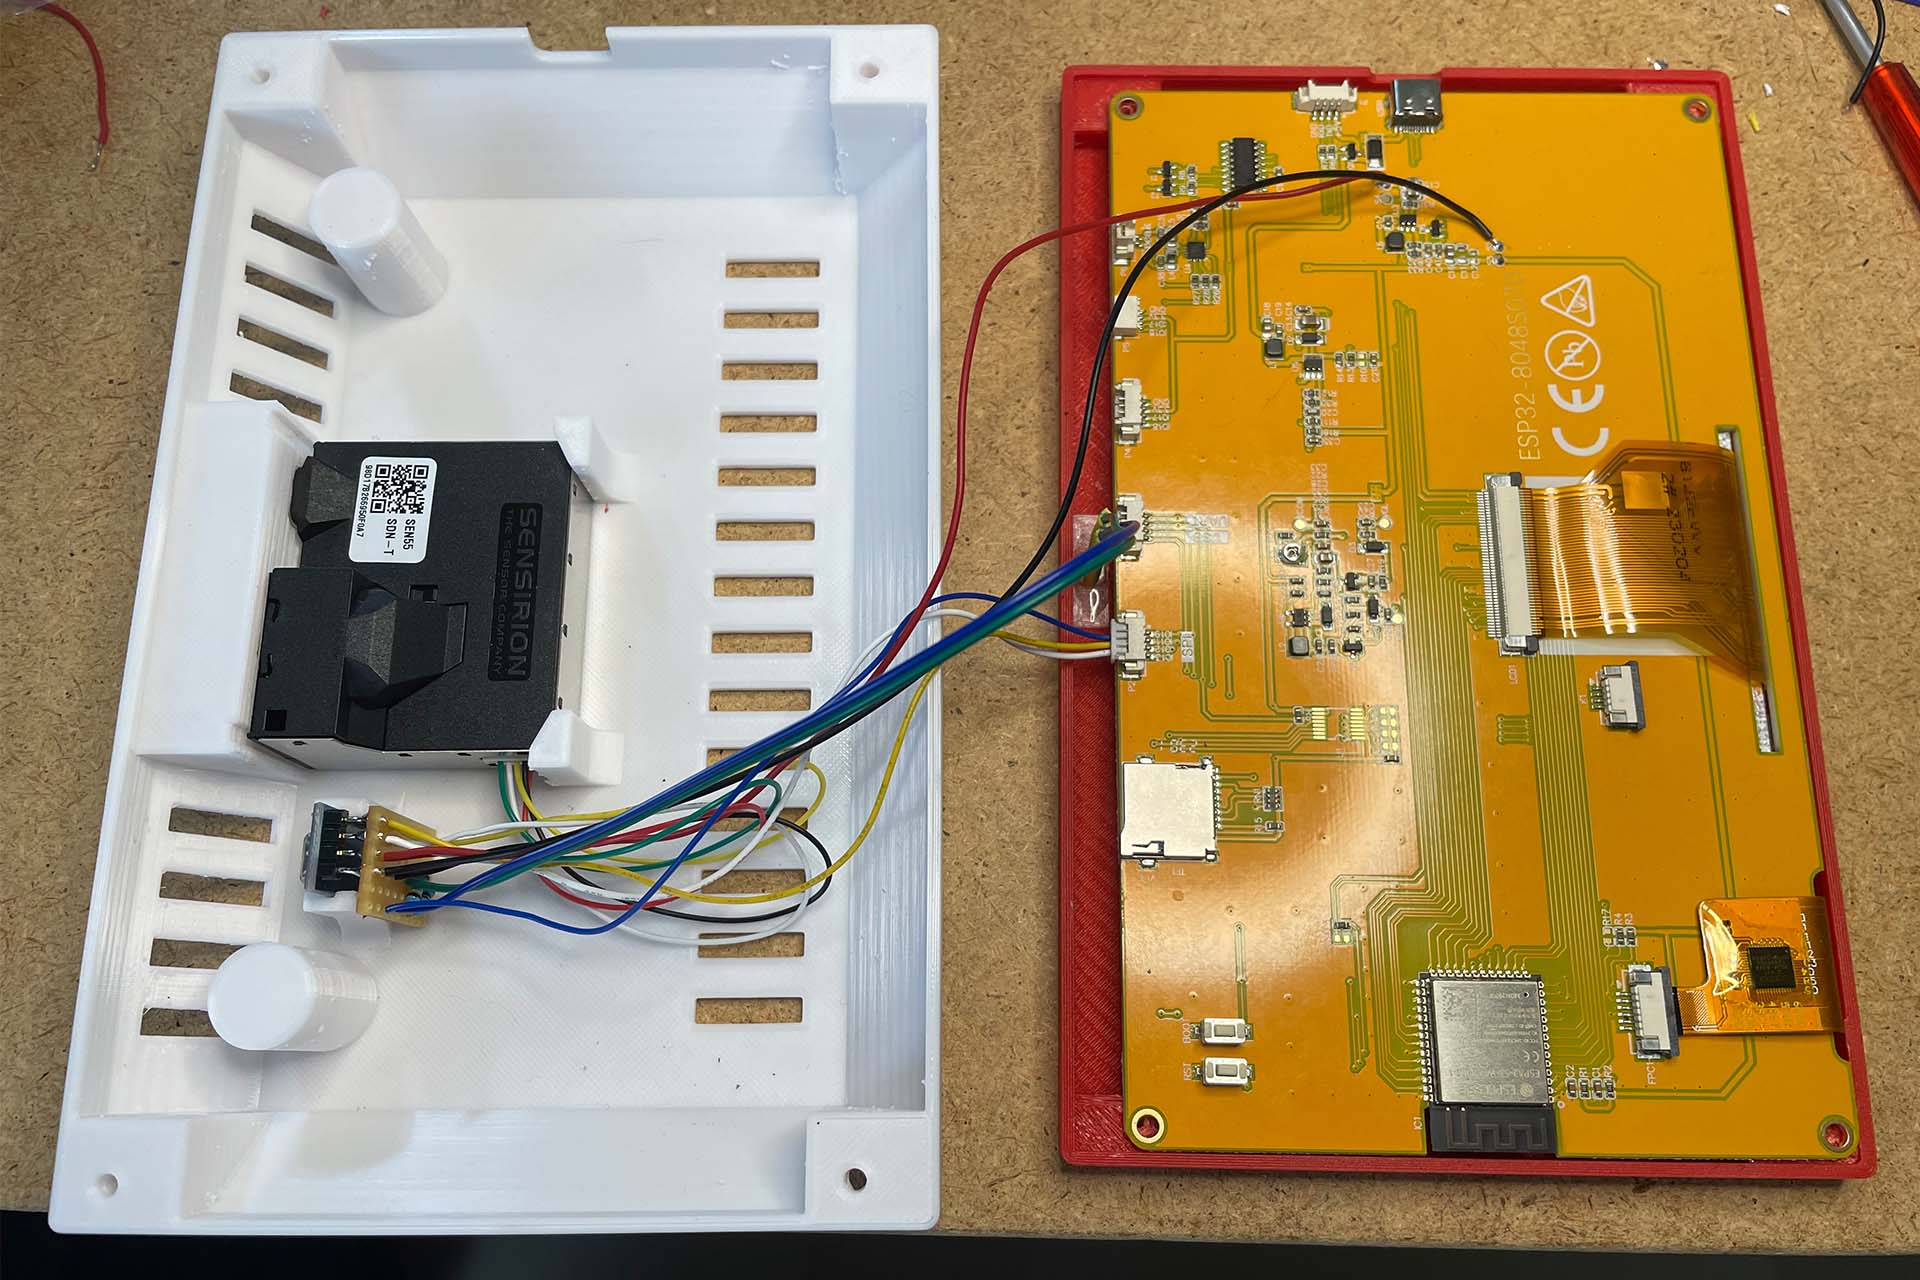
For the wiring I used a small strip grid board on which the resistors are also soldered. This solution is not very nice, but it works. Unfortunately, the display does not offer the 5 volt supply voltage, which the sensors need, on any of the connectors. Therefore I soldered two wires for ground and 5 volts directly on the display. On the following photos you can see the wiring of the sensors and the photoresistor to the display.
Software
The software of the base station was developed with the Arduino Framework, because it has all the necessary libraries I needed.
- ArduinoJSON: parsing of the OpenWeather data
- LovyanGFX: Driver for the display
- LVGL: Graphics library for the display
- Sensirion SCD4x: Driver for the CO2 sensor
- Sensirion SEN5x: Driver for the SEN55 environmental sensor
The following diagram shows the structure of the software. After the start a thread is started for each task. These update the respective area in the display. Since LVGL is not threadsafe, access is controlled by a semaphore so that only one thread can access at a time.
The layout of the GUI component was mostly created with SquareLine Studio. Only the widgets for the two charts I had to develop myself. Unfortunately, the LVGL documentation about creating your own widgets is very poor to non-existent. Accordingly, this part took me a lot of time.
The source code is on GitHub. At the moment there is no setup screen. Therefore, like WLAN settings in the file network.cpp and the parameters for the weather API in weather_task.cpp must be entered.
User Interface
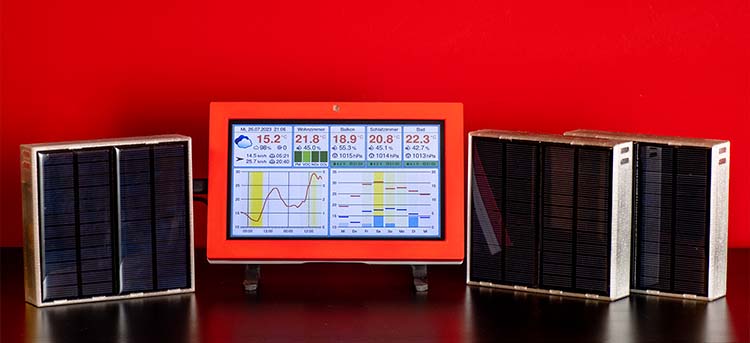
The design of the user interface is largely identical to the previous version. Only the data of the environmental sensors have been added. Originally I wanted to display the raw data of the sensors, but finally I got convinced that colored indicators are clearer. The display is divided into three parts, the data of the weather API (current values, hourly and daily forecast), the data of the base station and the data of the wireless modules. The following pictures show two examples of the display:
Winter: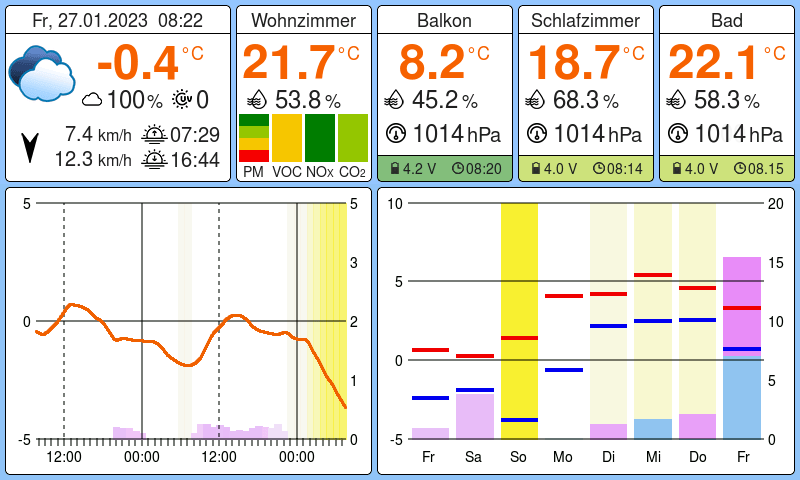
Summer: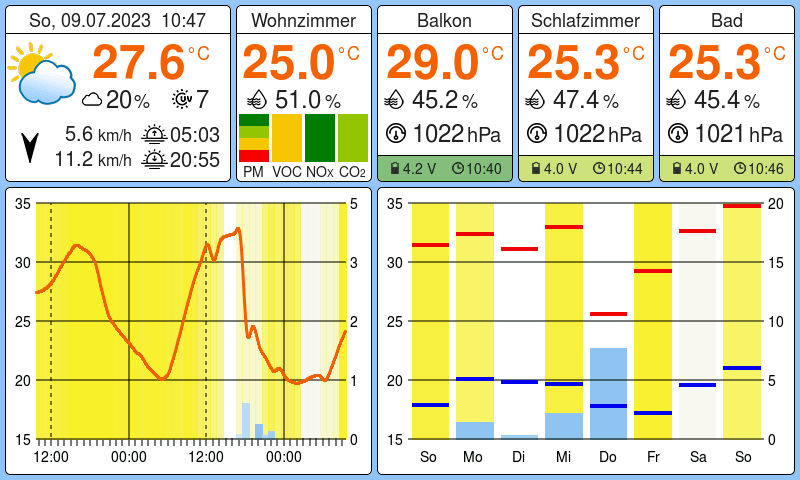
The blue and purple bars represent the amount of precipitation for rain and snow, where blue represents rain and purple represents snow. The intensity of the color indicates the probability of precipitation. The yellow background symbolizes the cloudiness level, the more yellow the less clouds.
Case
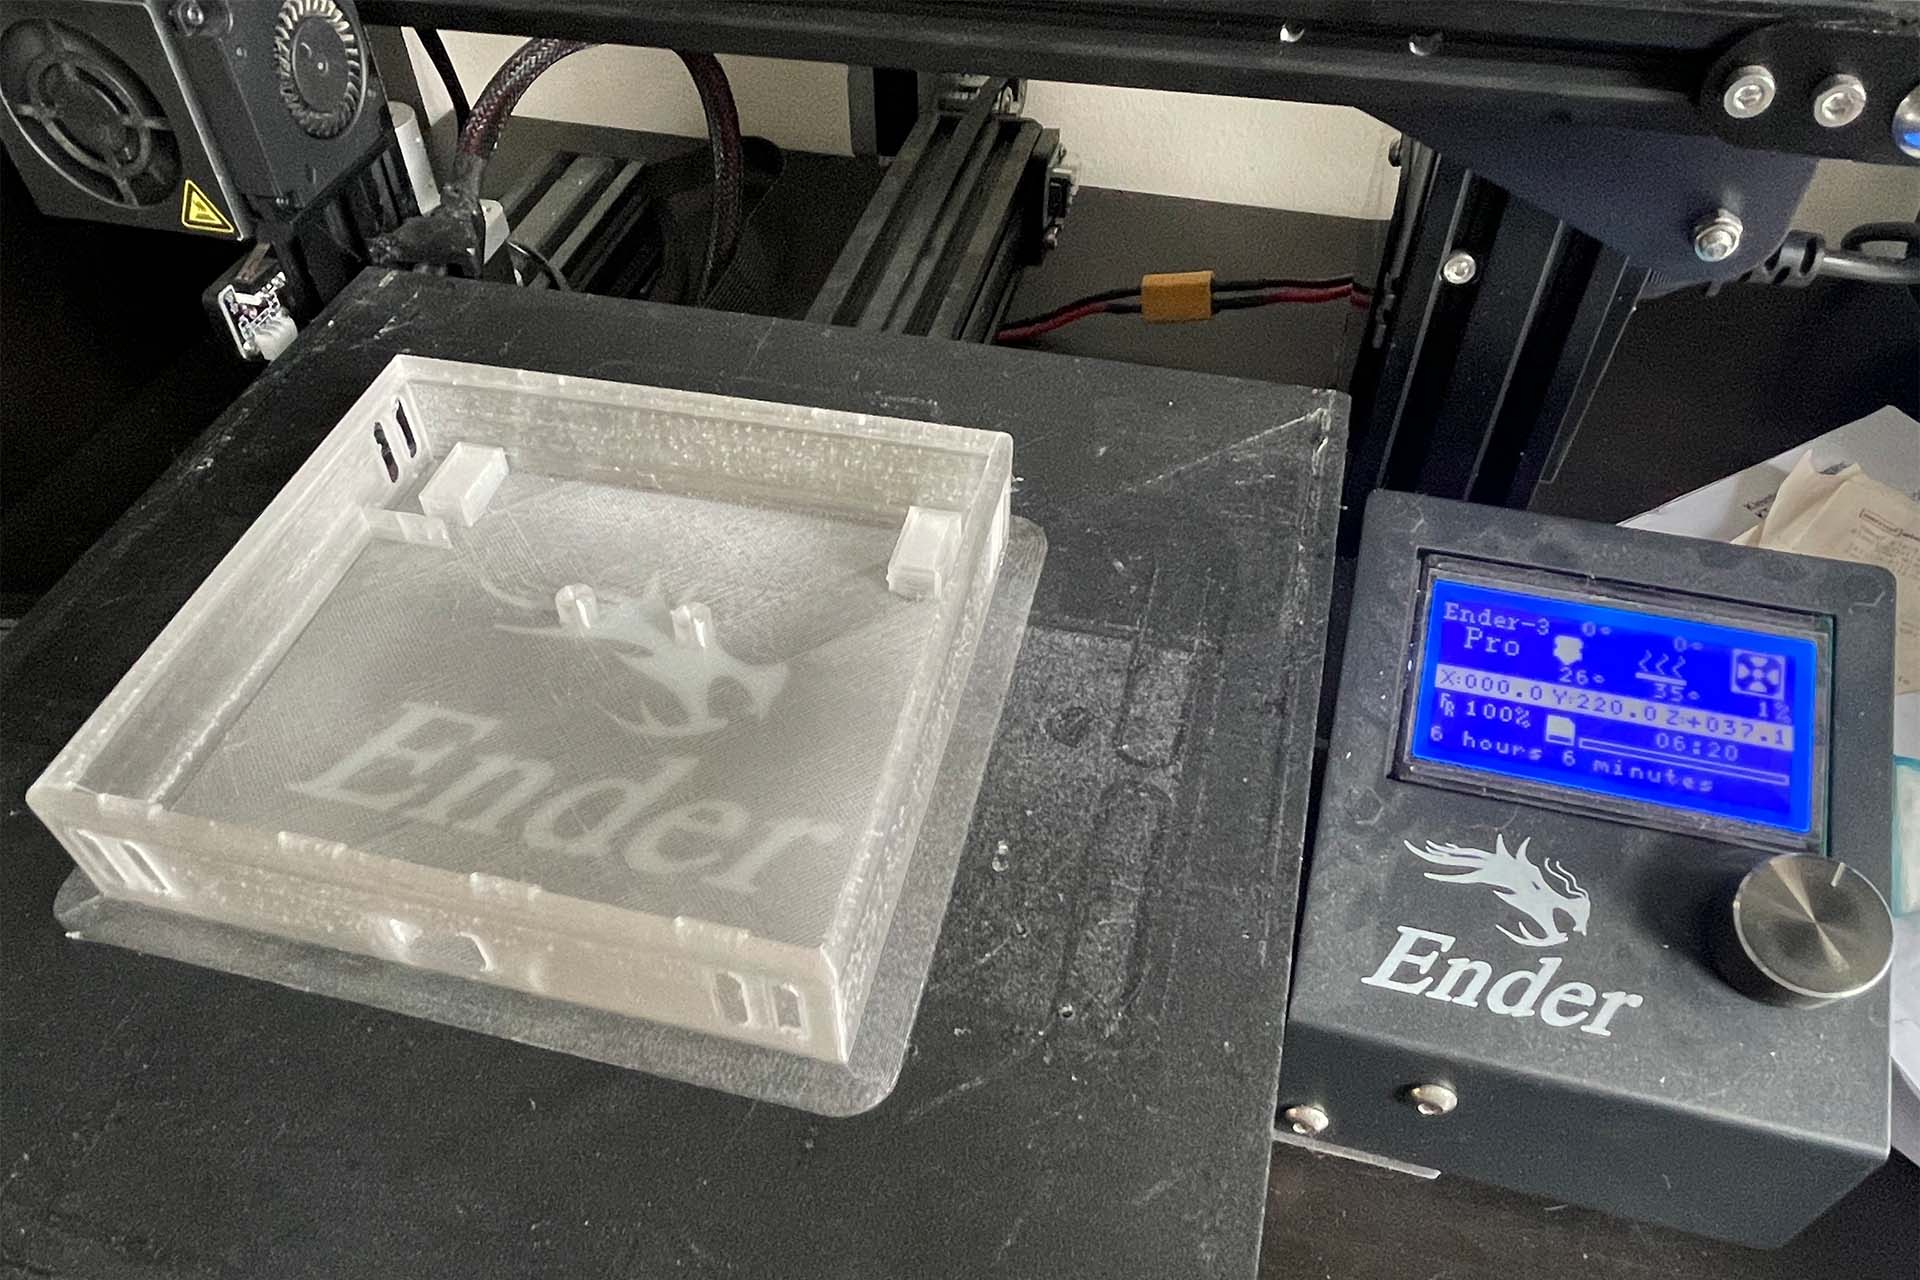
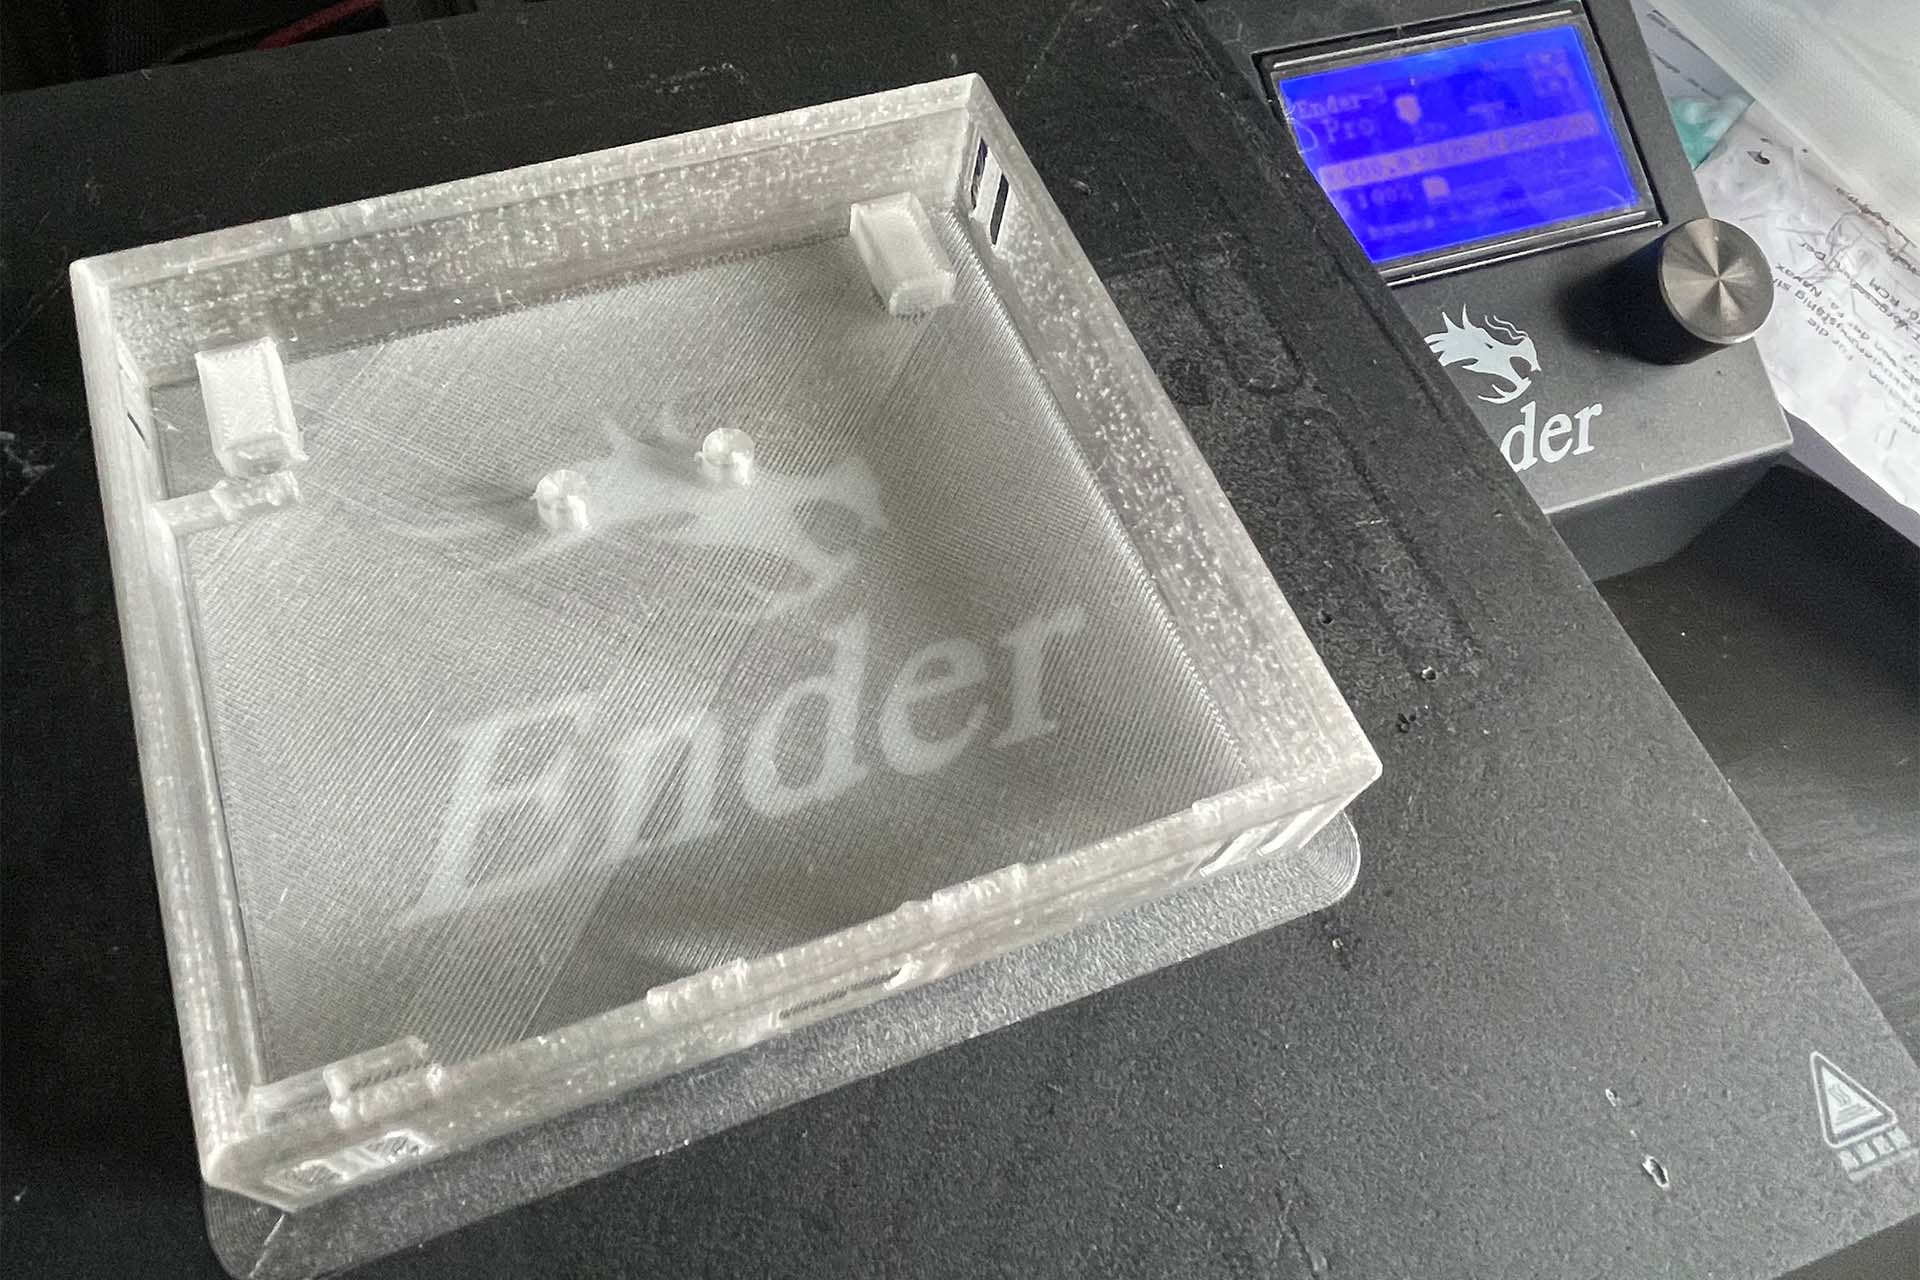
Of course, the weather station also needs a nice case. The print was again made with my good old Ender 3 in PLA. To be on the safe side, this time I printed all the parts with support, which worked well, but removing the support was very tedious at times.
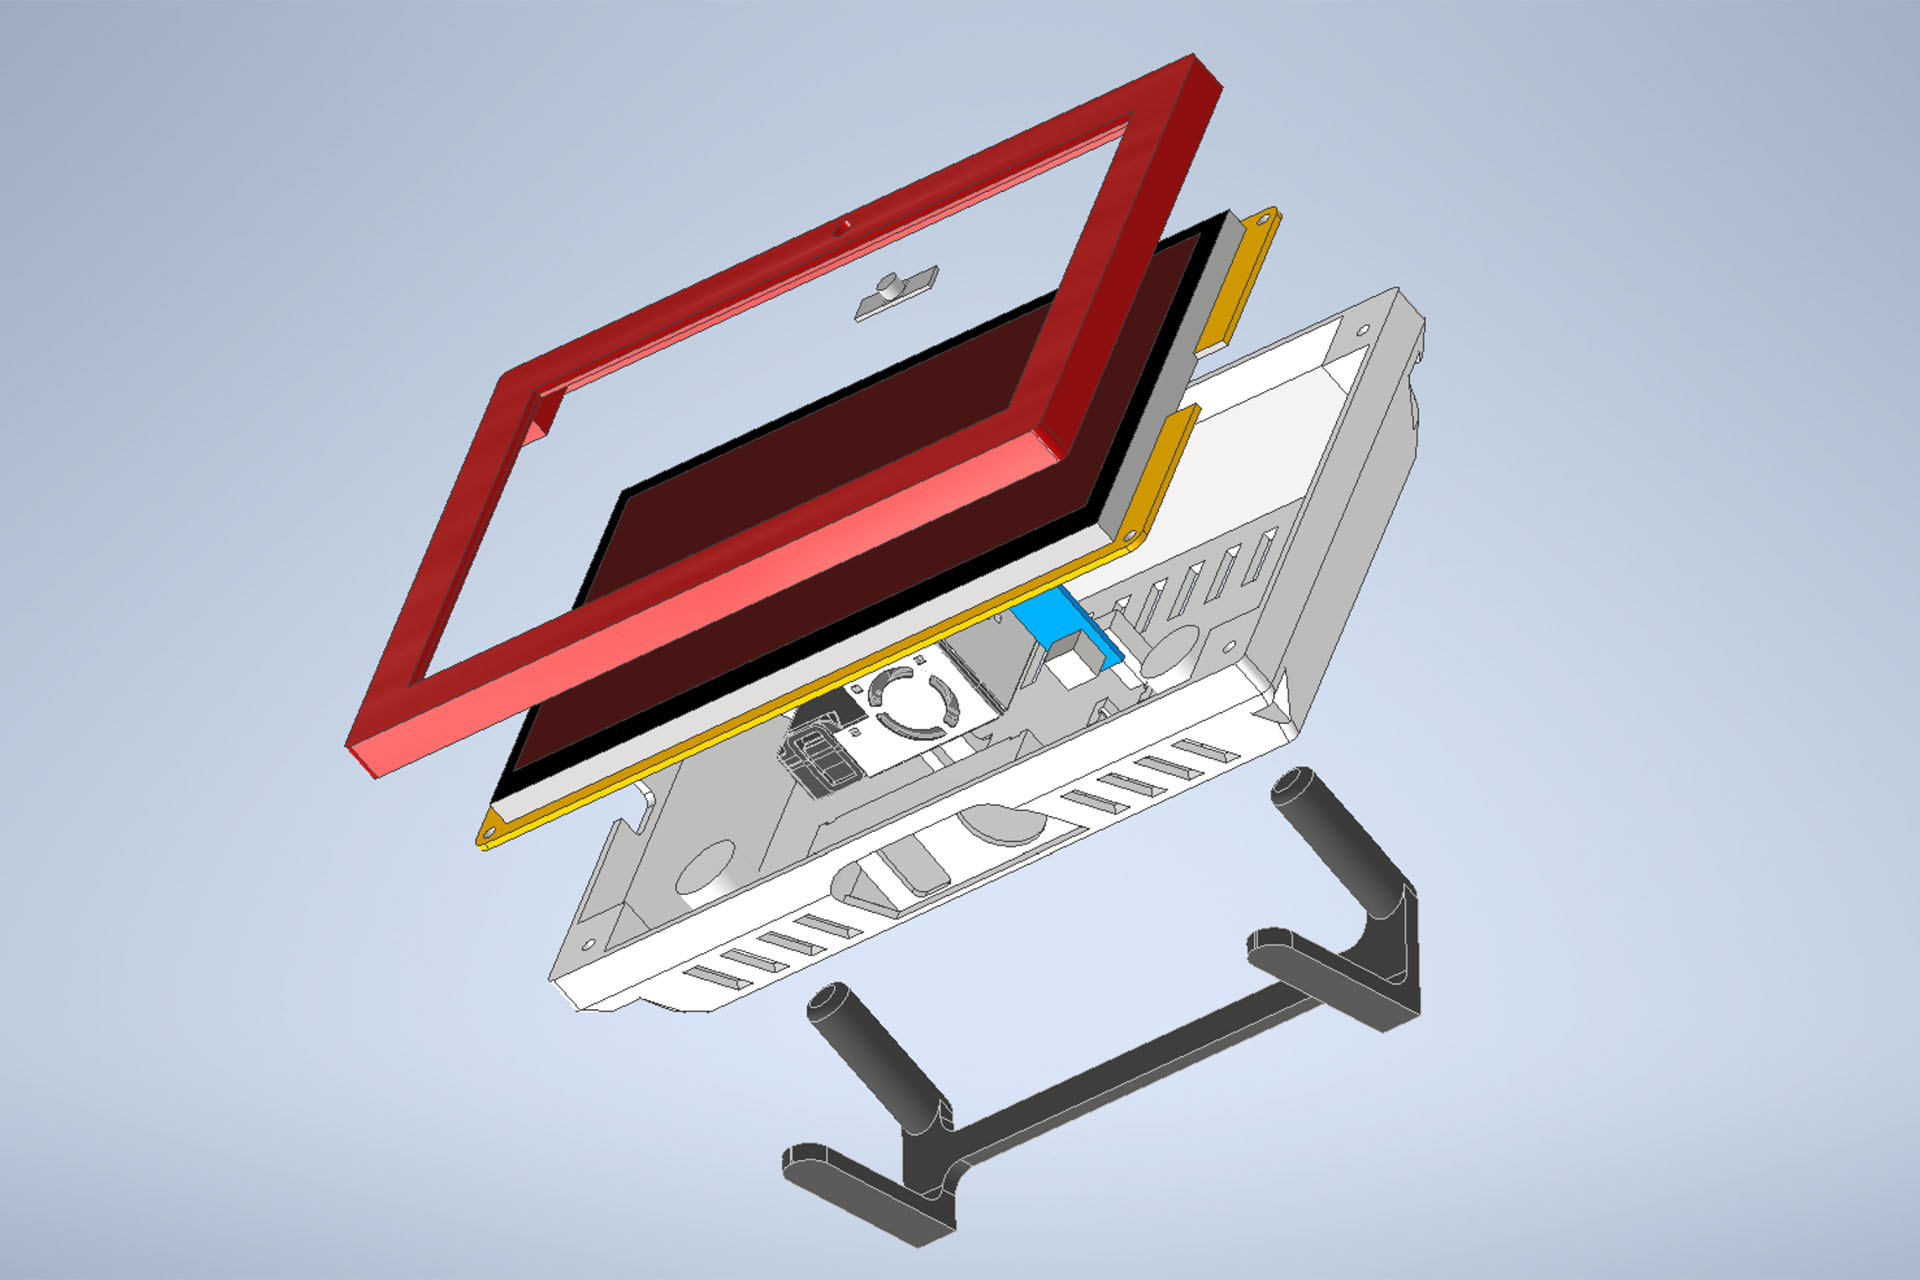
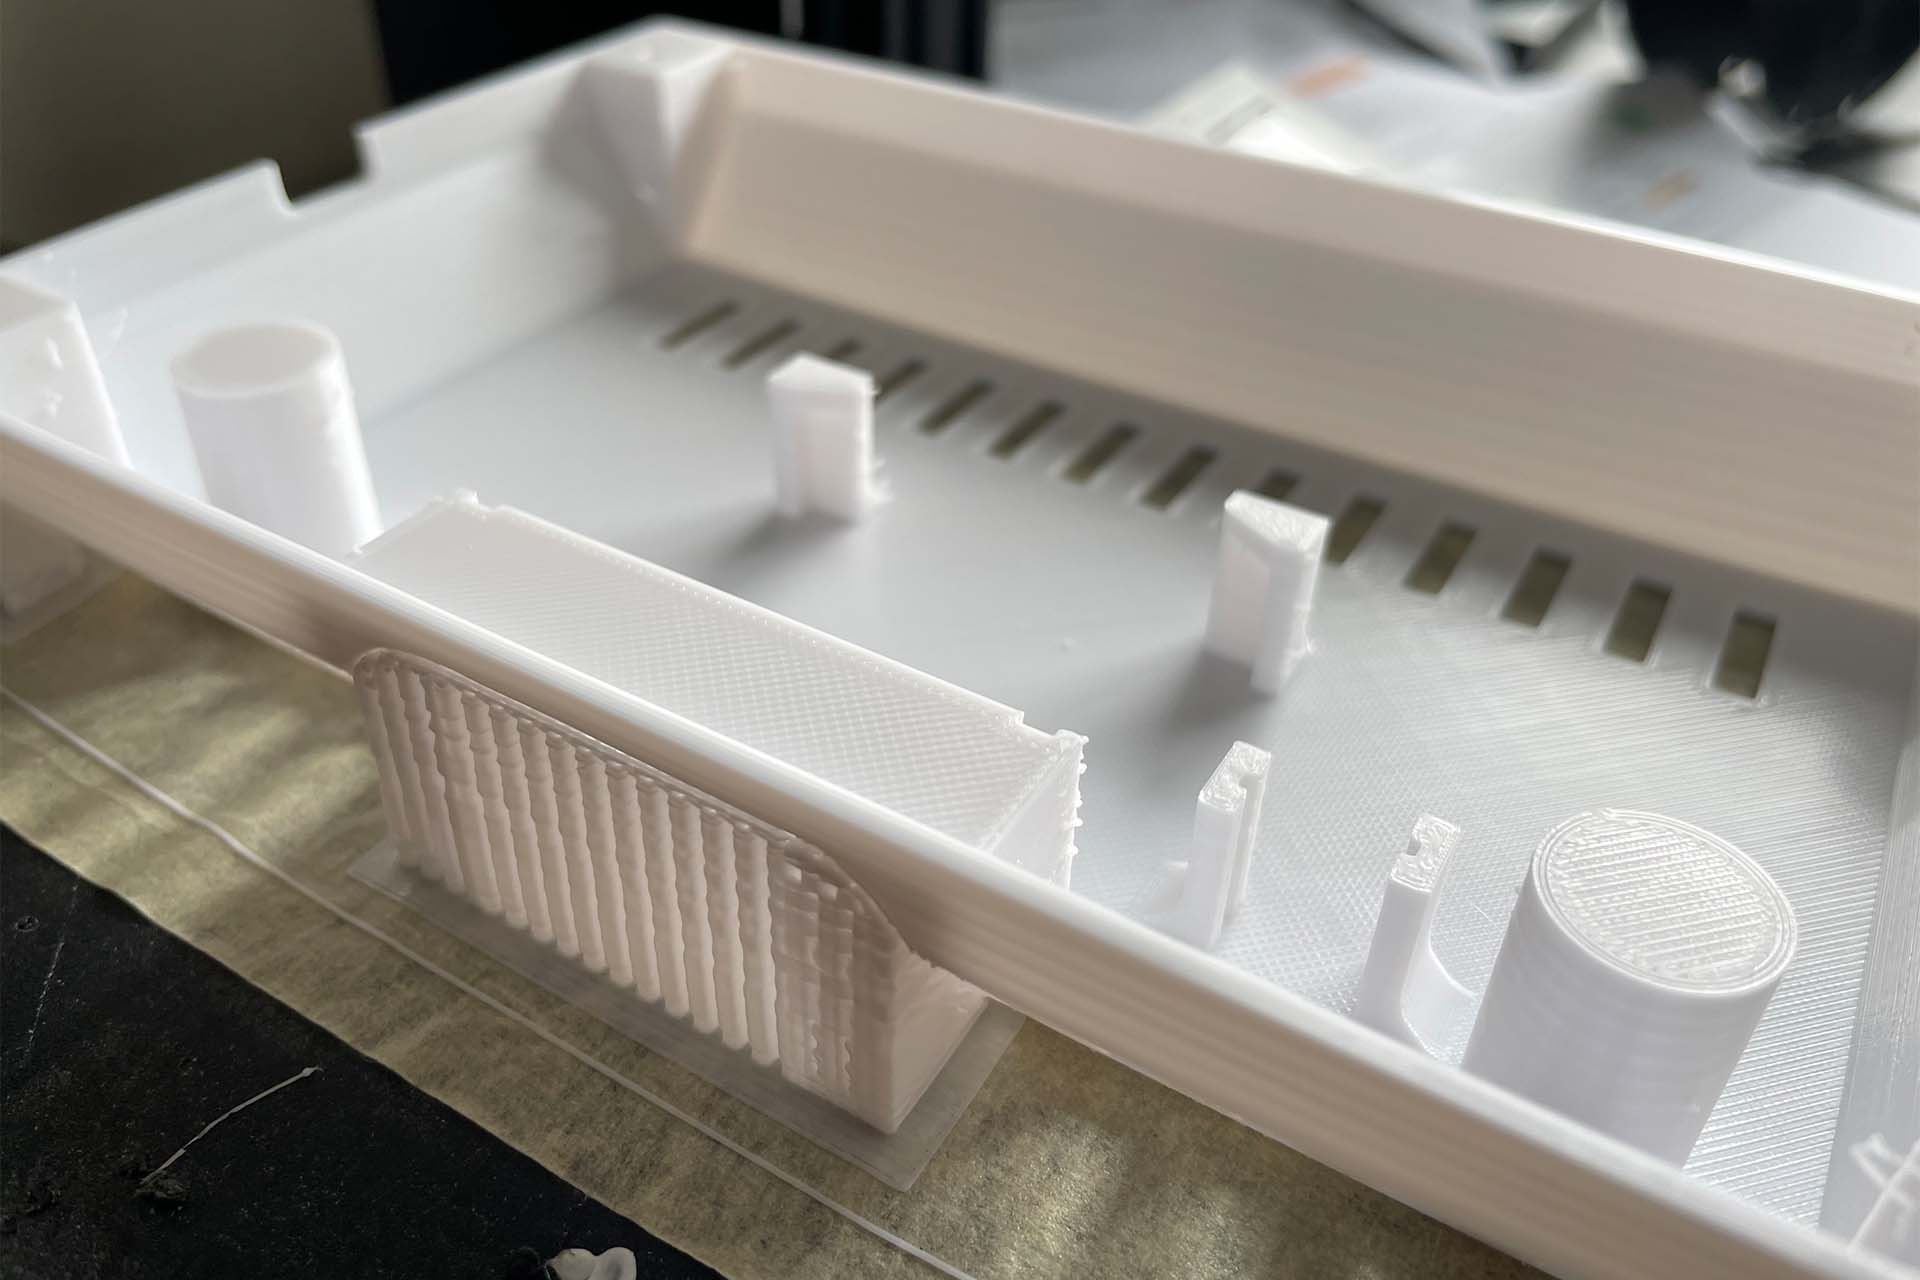
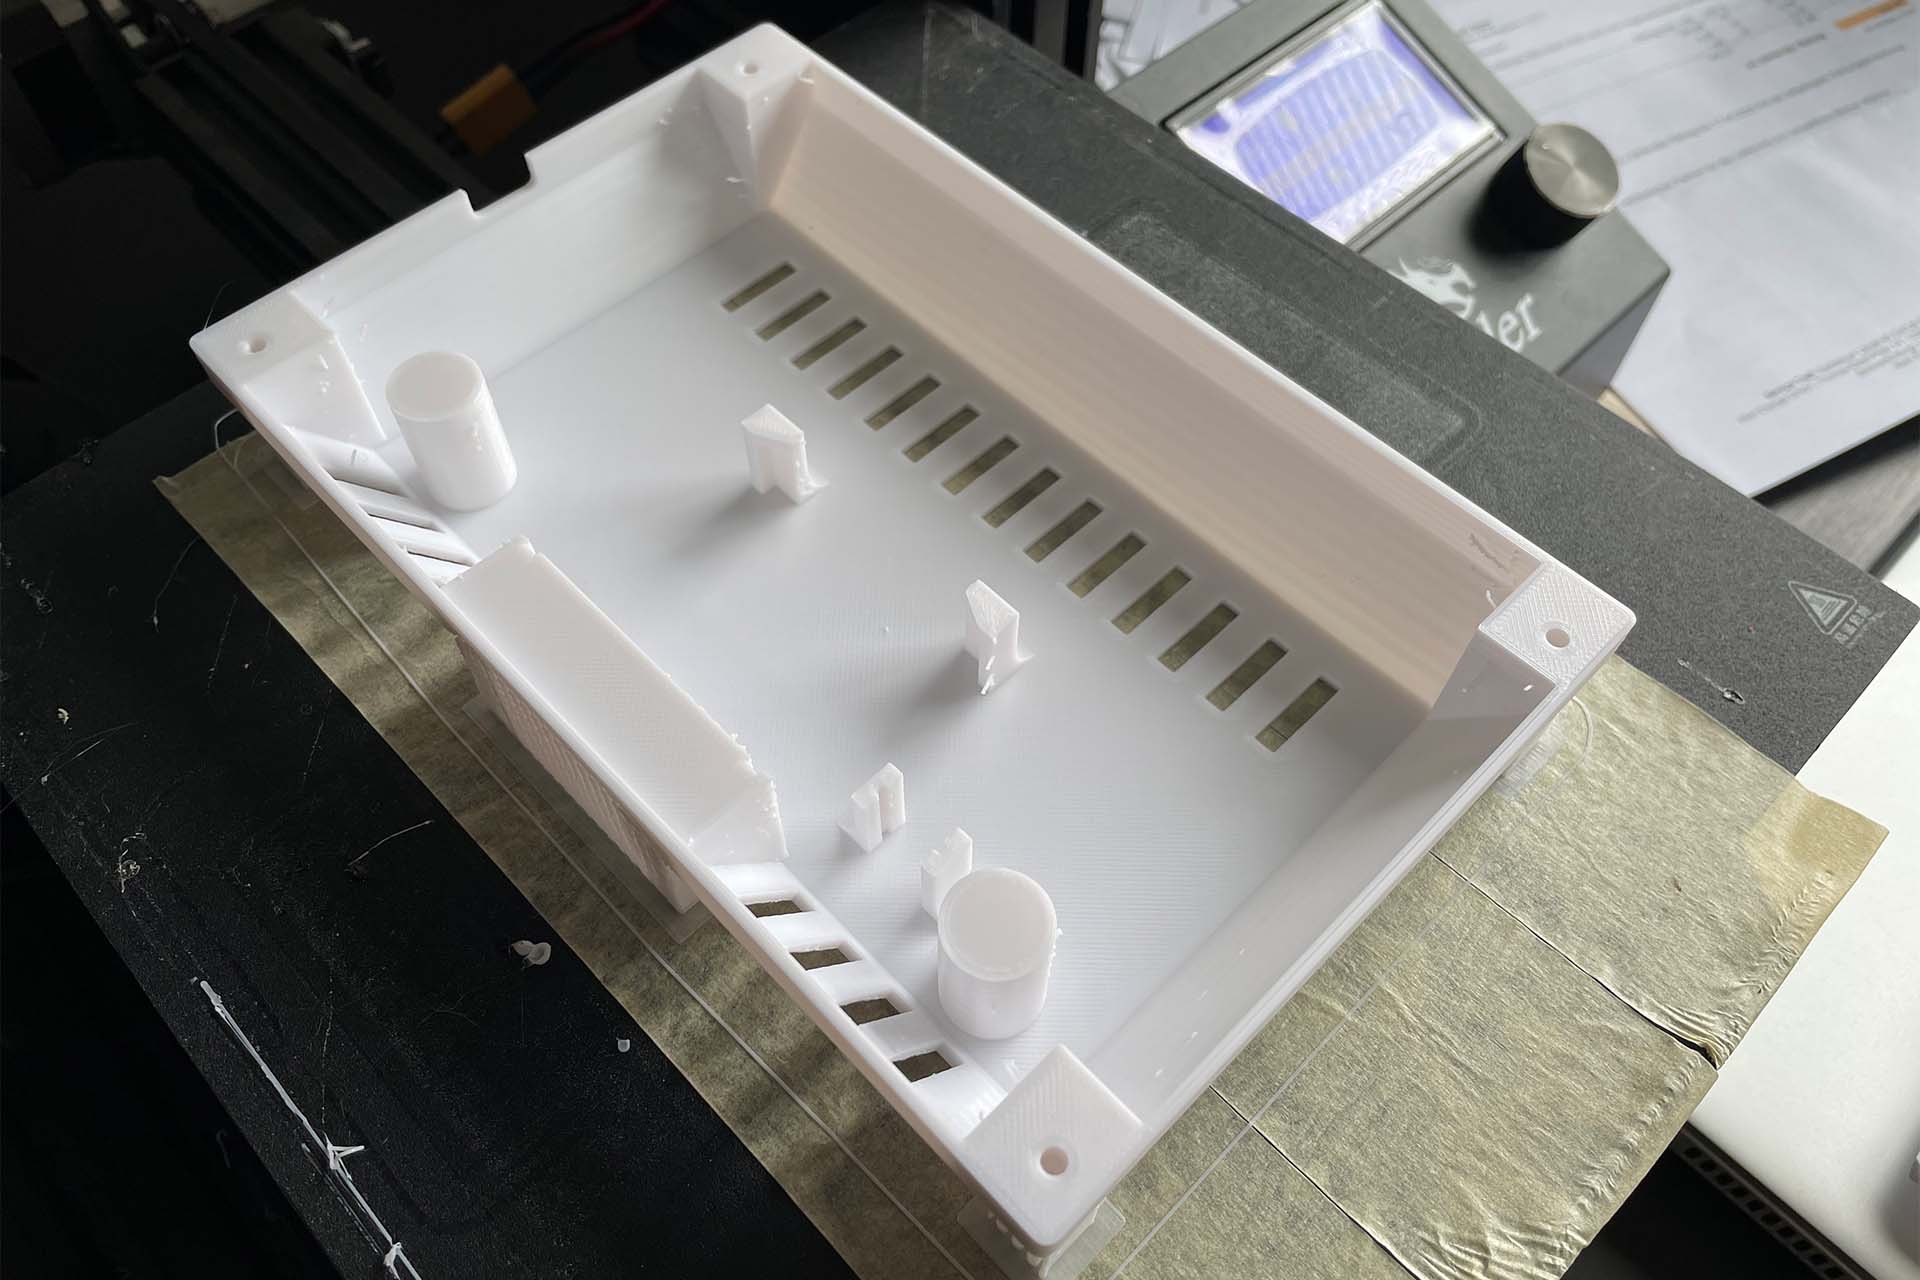
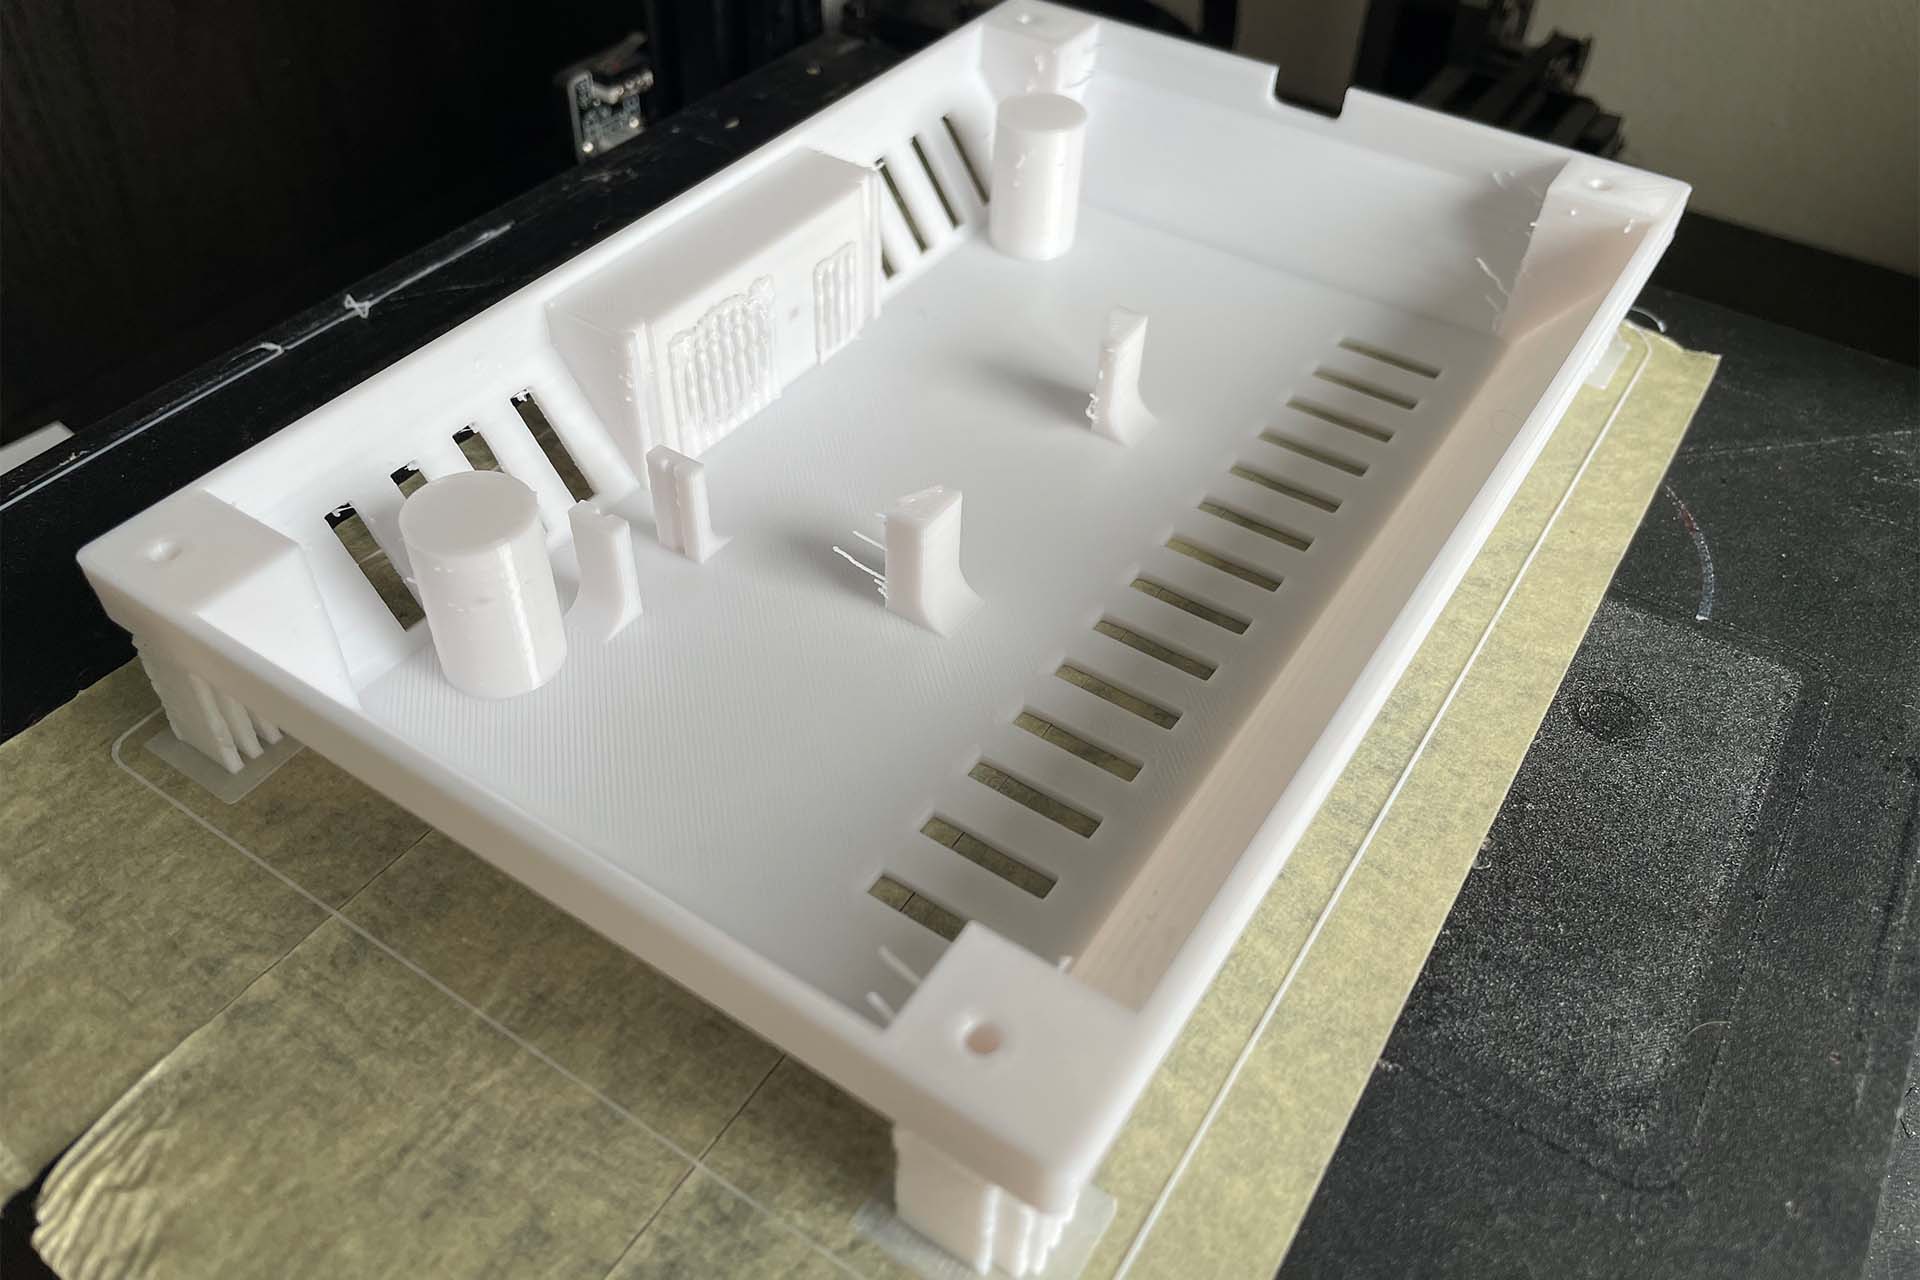
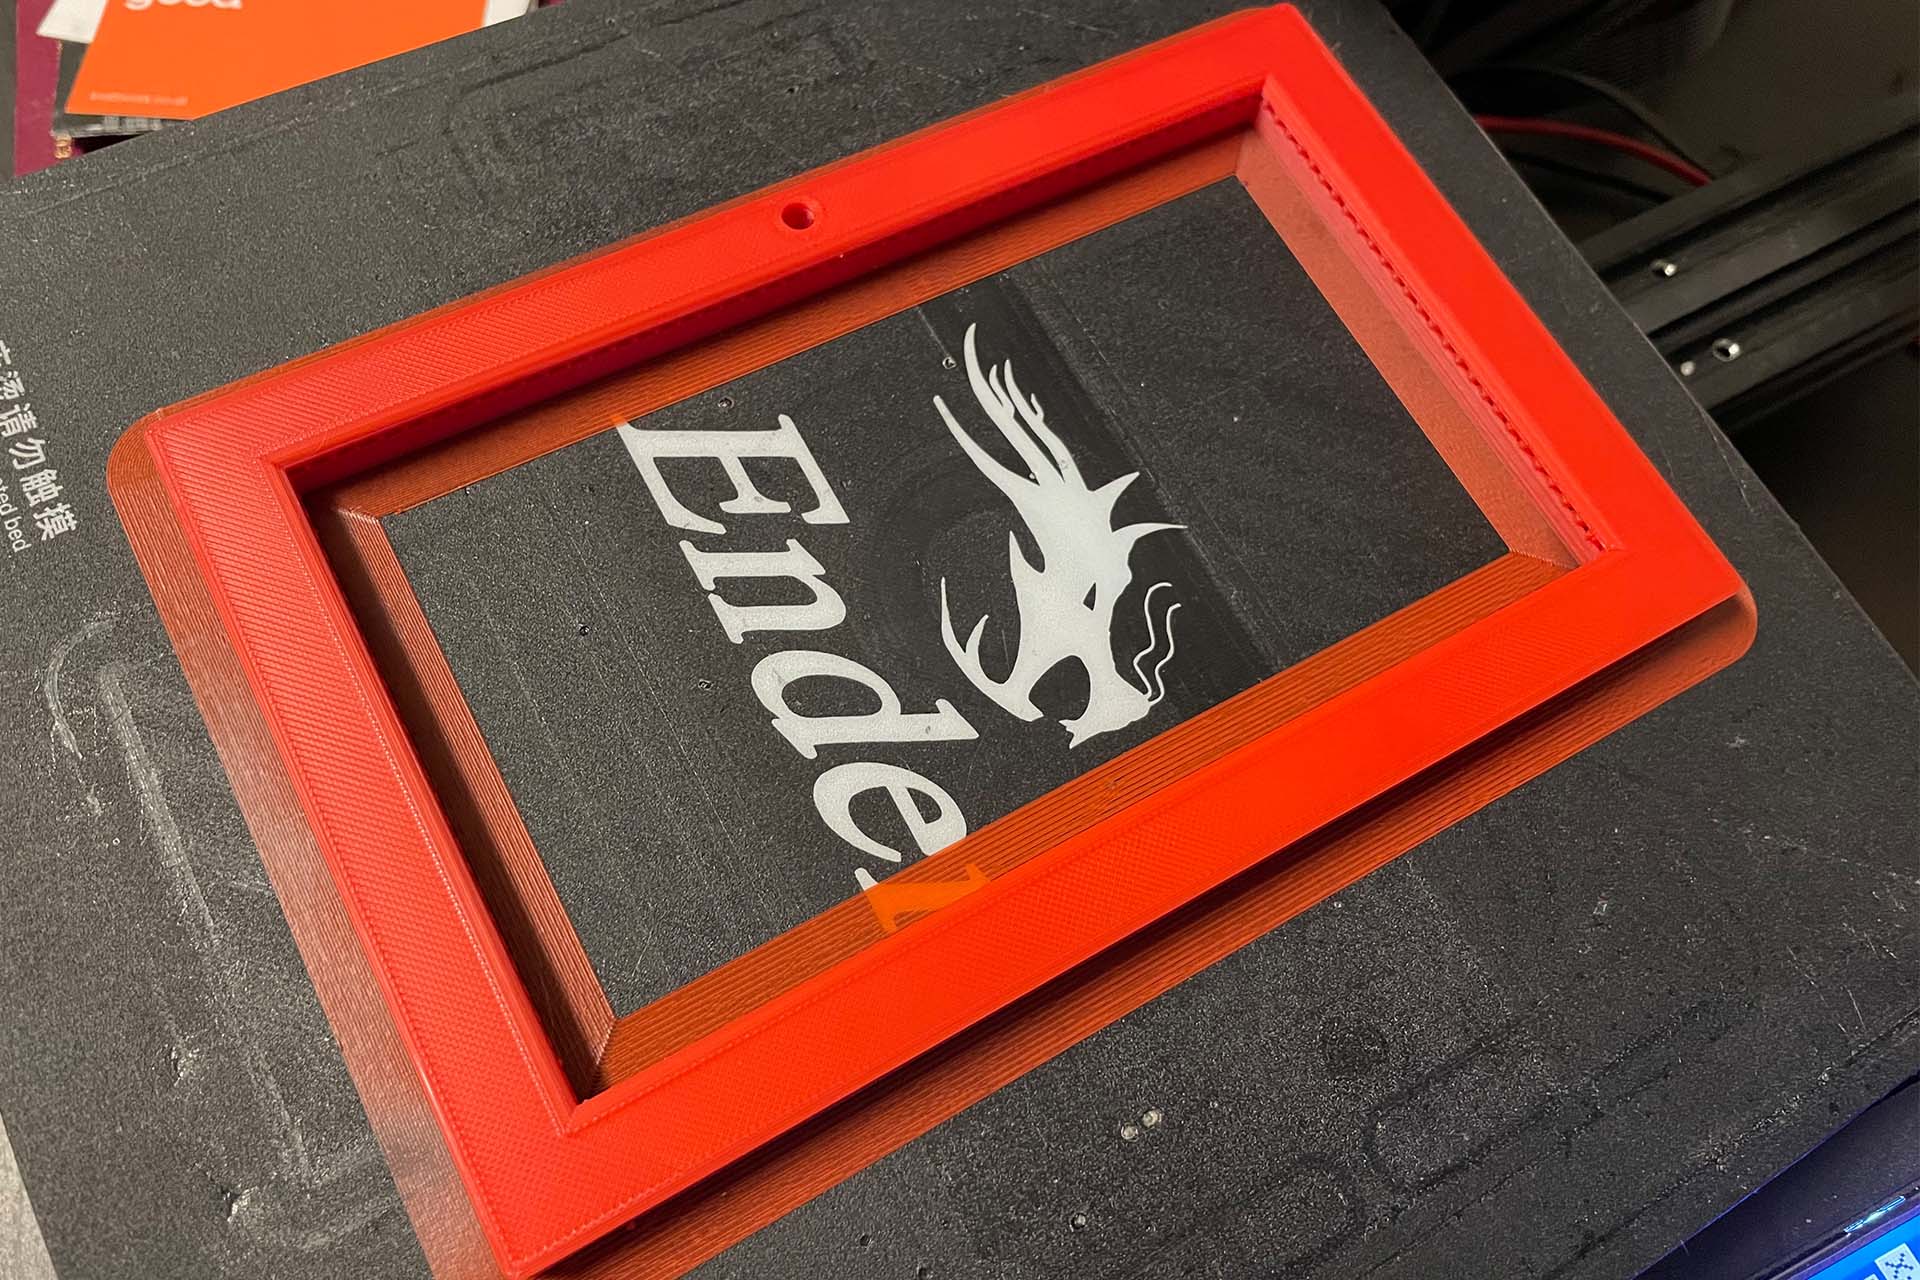
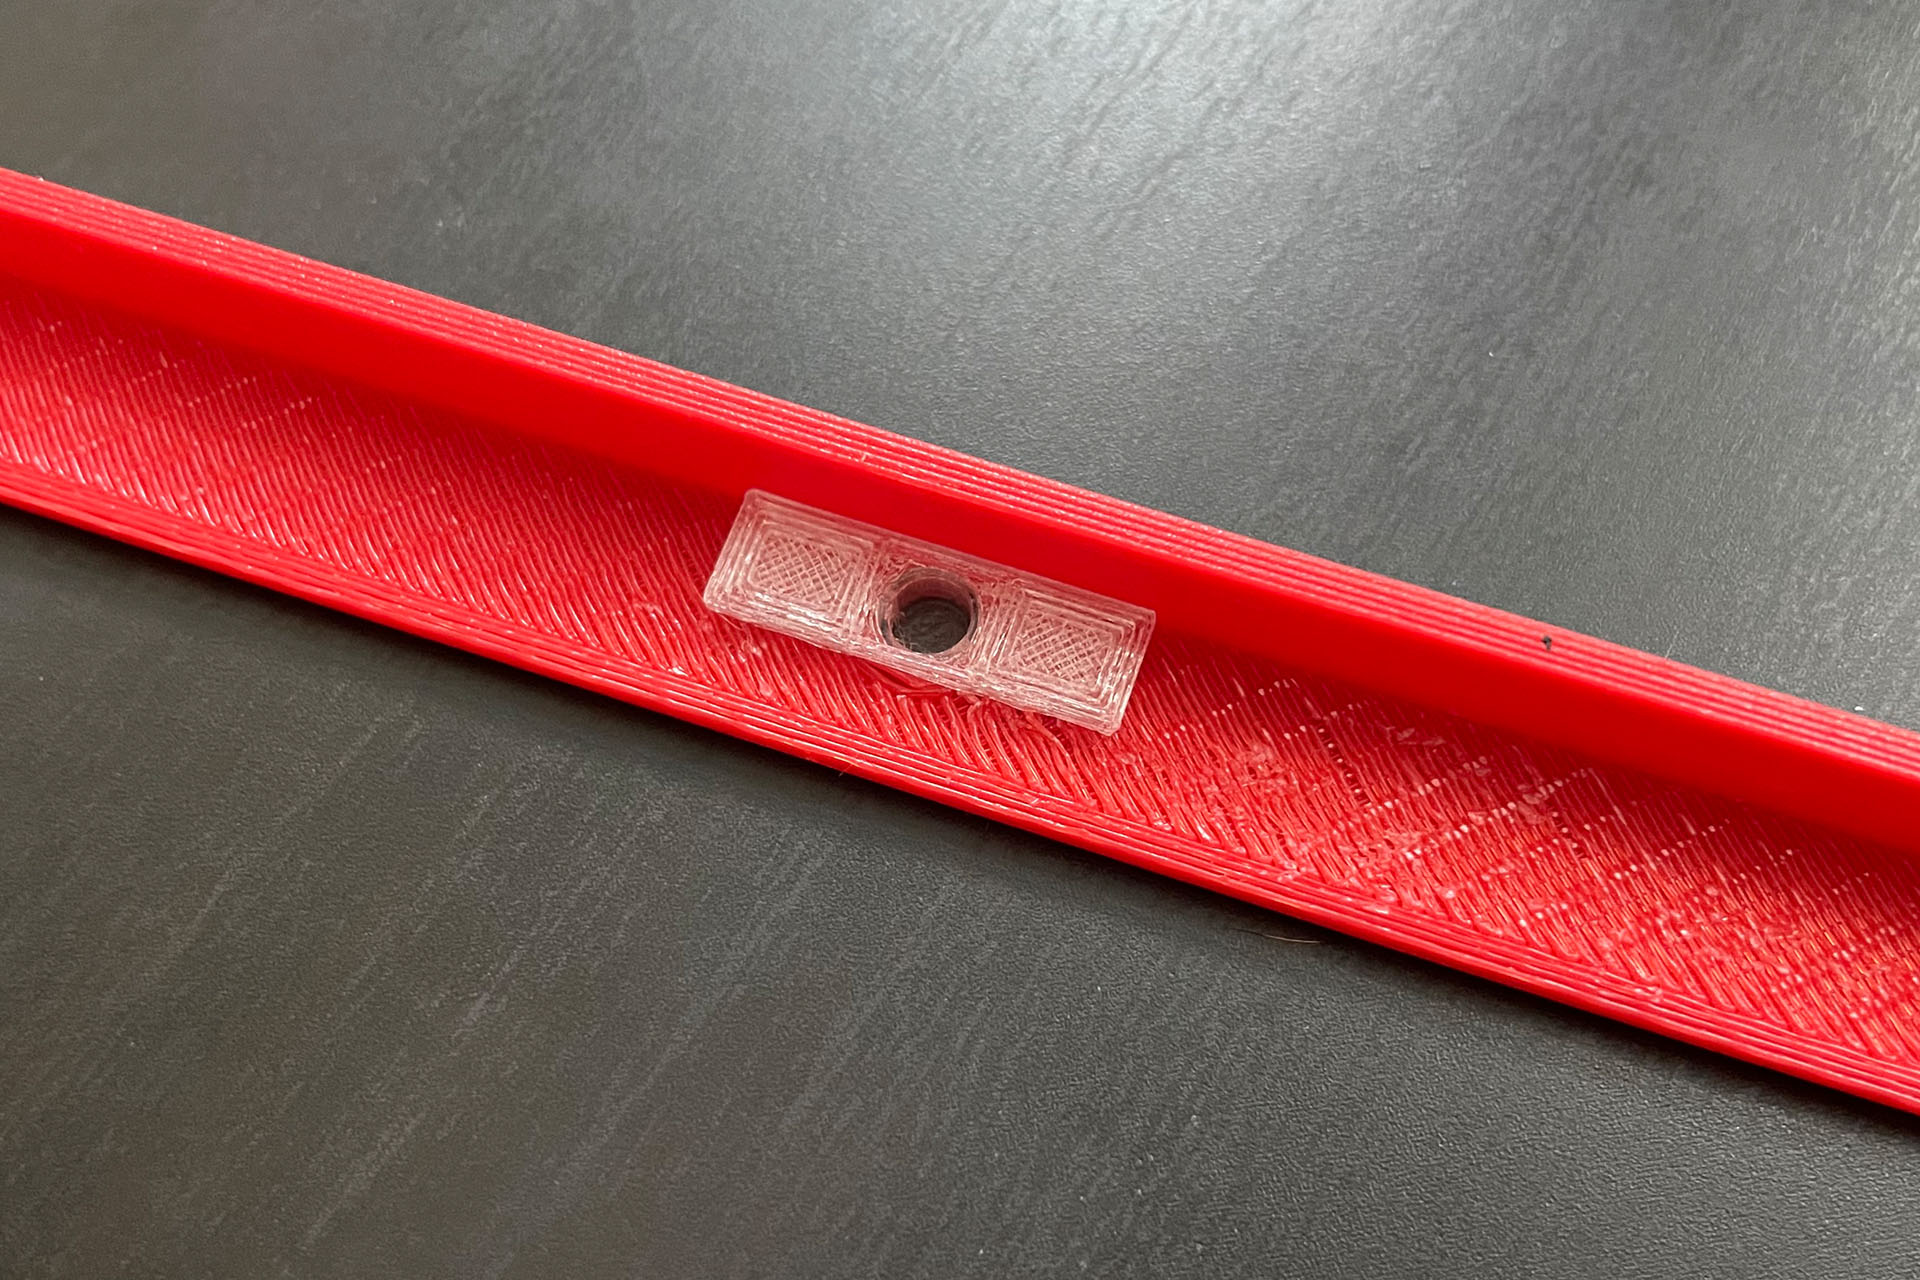

All parts are either simply plugged together or screwed. The only exception is the photoresistor, which I glued directly to the small transparent part, which in turn is simply plugged into the frame.
The STL files for printing are on GitHub.
The wireless sensor
The wireless sensor is a premiere. Until now I only designed the boards and then soldered the single components by hand. These were on the one hand normal components like resistors, capacitors etc. or ready made components like an ESP32 module, charge controller and so on. This time I designed the complete wireless sensor from schematic to board by myself. For this I used EasyEDA and had the wireless sensor produced by JLCPCB. This worked very well and I am also very satisfied with the support.
[Update 07.04.2024] I have now also built a cheaper version with an ESP32-C6. Details can be found in this article.
Hardware
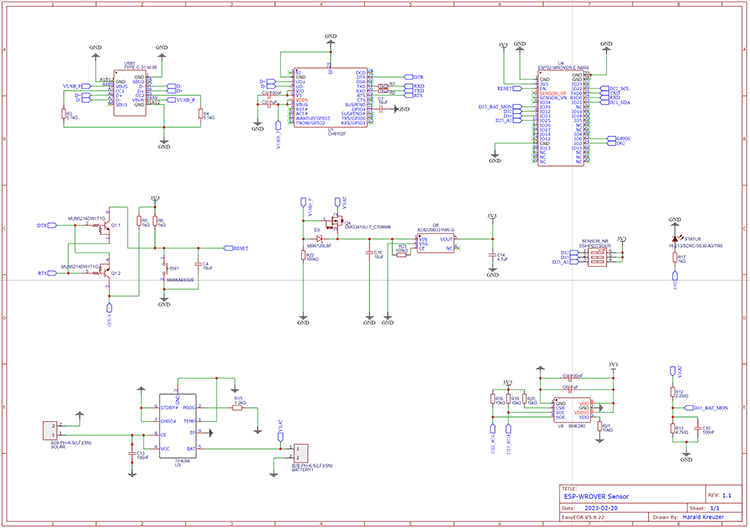
The wireless sensor was designed with a focus on low power consumption. The microcontroller is an ESP32. I don't know any other general purpose microcontroller that has such a low power consumption in deep sleep mode and also offers Wi-Fi functionality. As voltage regulator I use a XC6220, for charging the batteries I decided to use the TP4056. I didn't use the classic LEDs, which show the charge state, to really use every µA for charging. The whole circuit diagram looks like this:
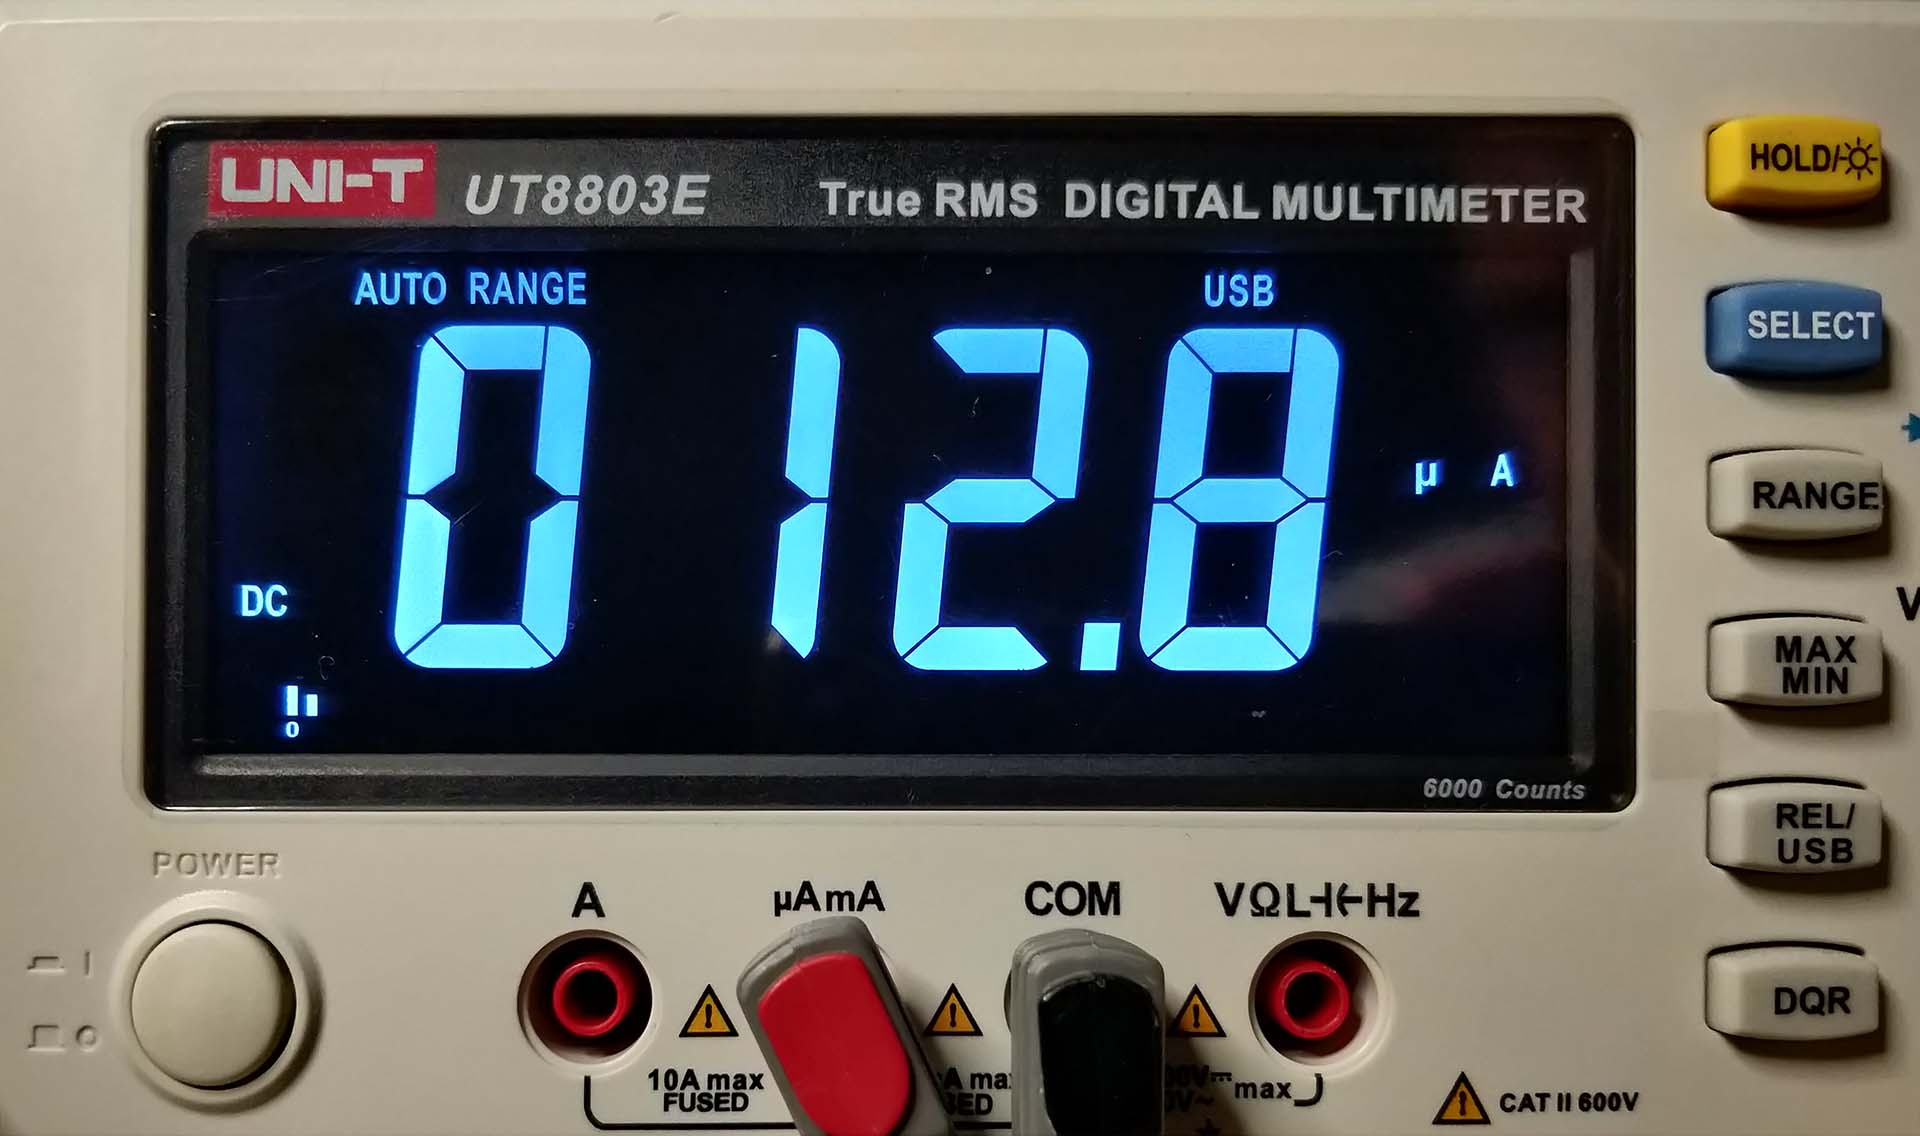
With this circuit I get a current consumption of 12.8 µA in deep sleep mode. I think this is a very good value. Other boards, like the ESP32-DevKitC from Espressif, consume a multiple here. At the beginning I had a value of over 200 µA, which shocked me quite a bit. But after some research the problem was found quickly. It is very important to reset the used pins with gpio_reset_pin() before starting the deep sleep mode.
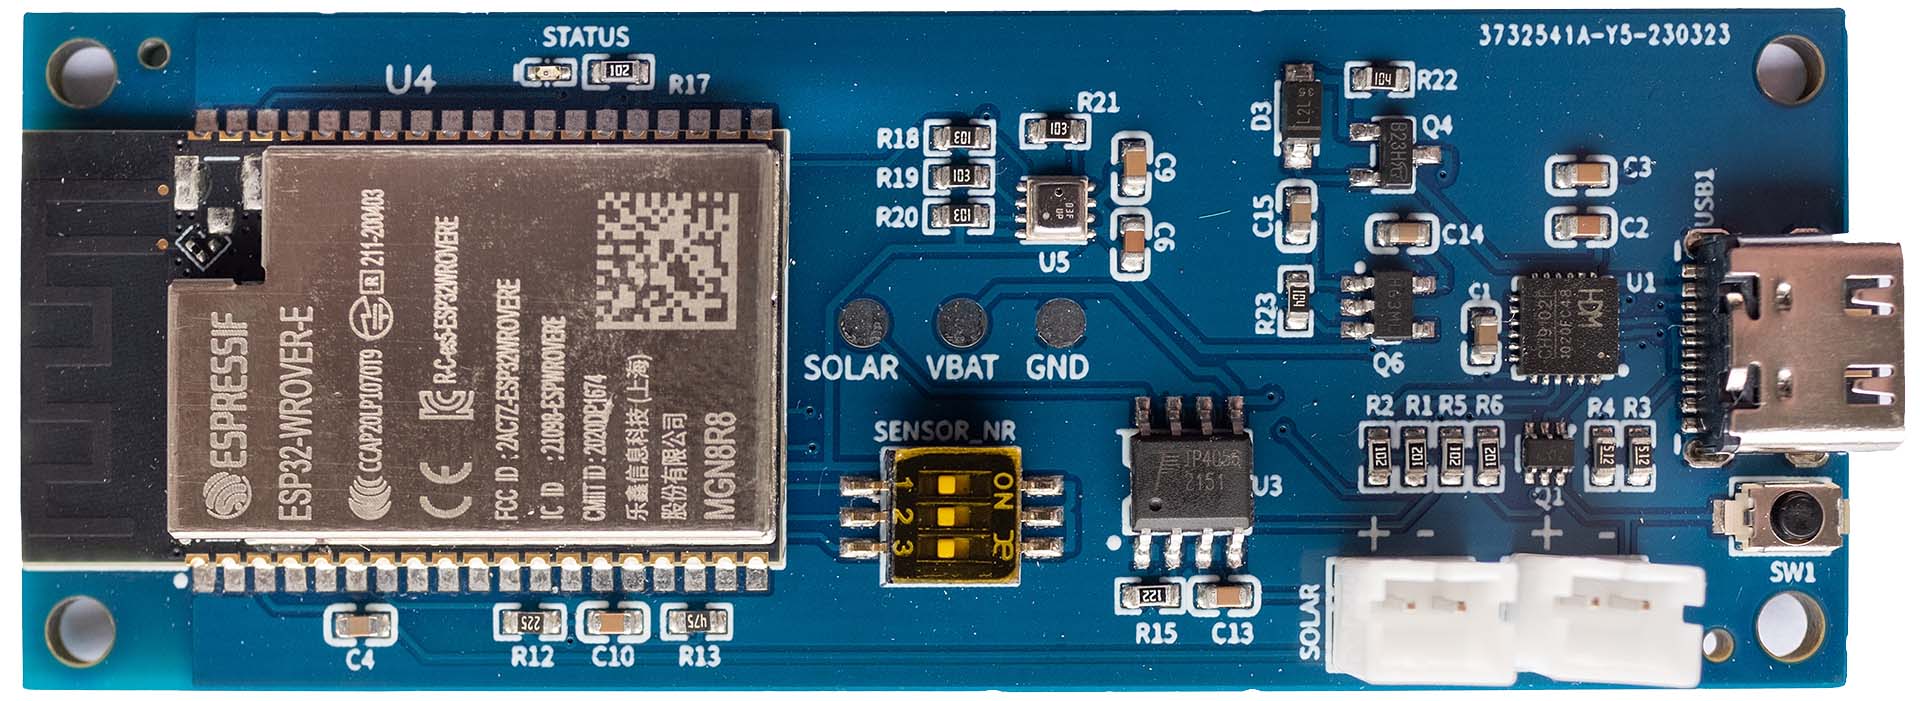
The finished board looks like this:
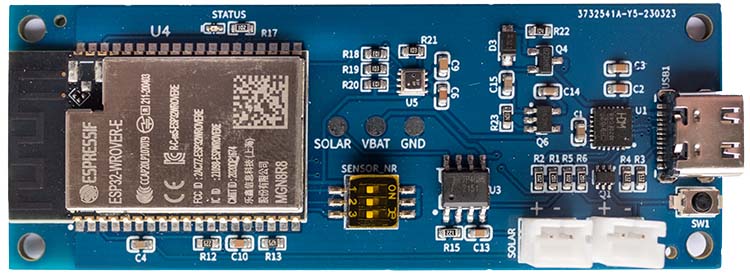
The PCB could have been designed a bit more compact for sure, but for my first attempt I am actually satisfied. Unfortunately my first design still had a bug and also JLCPCB placed a component wrong. But the support was very helpful and sent me new boards for a very reasonable price. They work perfectly now.
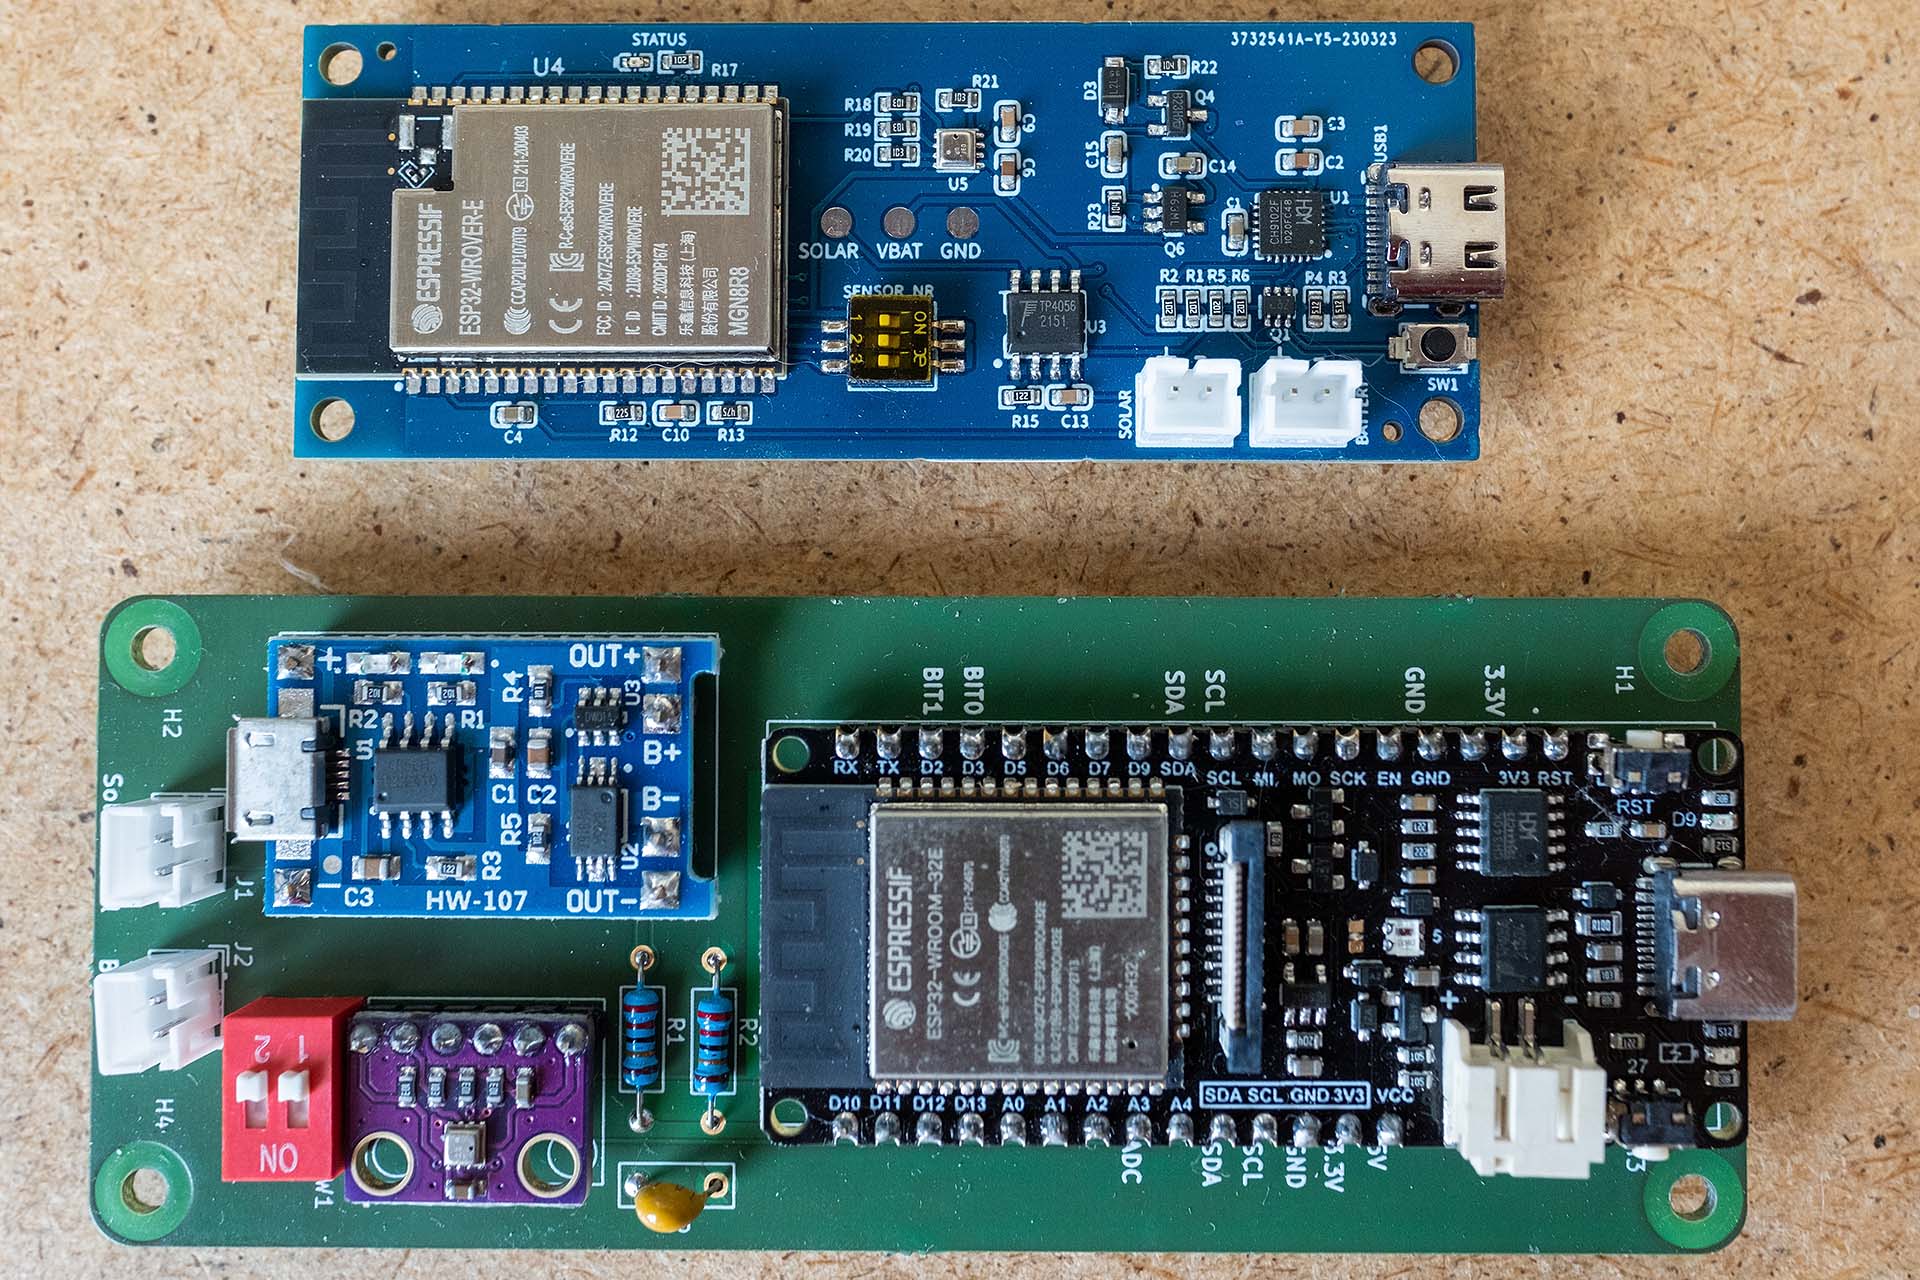
On the following photos you can see the comparison of the 3D view in EasyEDA with the physical board and also the comparison with the earlier design, which was still based on finished components.
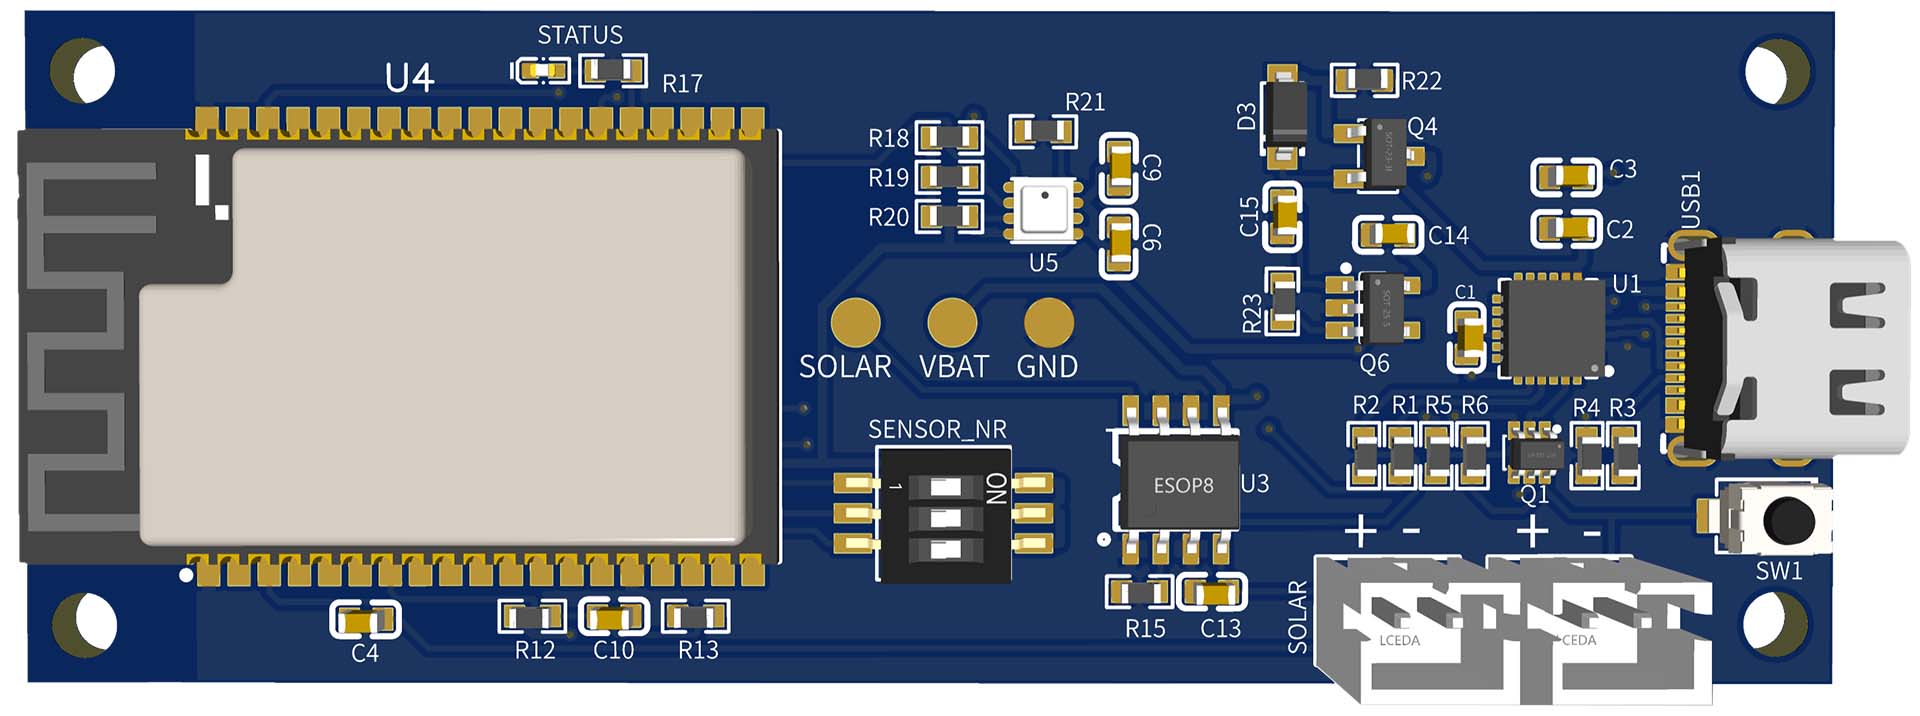
You can find the schematic, PCB and BOM on oshwlab.com.
Software
The software for the wireless sensor is written in C with the ESP-IDF framework. The setup is simple and consists of initializing the hardware, reading the sensor data and sending the data. After that the sensor is in deep sleep mode for 10 minutes. A complete run from waking up the ESP32 to starting the deep sleep mode takes about 800 ms. From this you can now calculate the theoretical maximum runtime (when not charging). I assume a consumption of 200 mA during the measurement:
0.8s x 200mA + 600s x 0.0128mA = 167.68mAs
A fully charged lithium-ion battery has a capacity of 2000 mAh or 7,200,000 mAs. Dividing the two values gives 7200000 / 167.68 = 42939 cycles. With a cycle length of 600.8 seconds, that's 42939 x 600.8s = 25,797,710 seconds, which in turn equals about 299 days. I am very satisfied with this value.
[Update 01/31/2024] In the meantime, I was able to determine the exact power consumption with the Power Profiler Kit II. It turned out that my estimate was far too pessimistic.
The wireless sensors communicate with the base station via the ESP-NOW protocol. Both transmitter and receiver must use the same Wi-Fi channel for this. Normally, this is not a problem, because you simply set the same Wi-Fi channel for the transmitter and receiver. But since the base station also uses the classic Wi-Fi, it gets a bit more complicated. As soon as the base station connects to the Wi-Fi, it is assigned a Wi-Fi channel by the router. But the wireless sensors don't know about this and have to find out which Wi-Fi channel they should use. For this purpose I developed an algorithm so that Wi-Fi and ESP-NOW can be used at the same time. The following diagram shows the process:
If a problem occurs after successful pairing, the current peer is simply deleted and pairing is started again from the beginning. This also covers the case when the router is not available for a while or the Wi-Fi channel has changed.
The source code of the radio module is on GitHub.
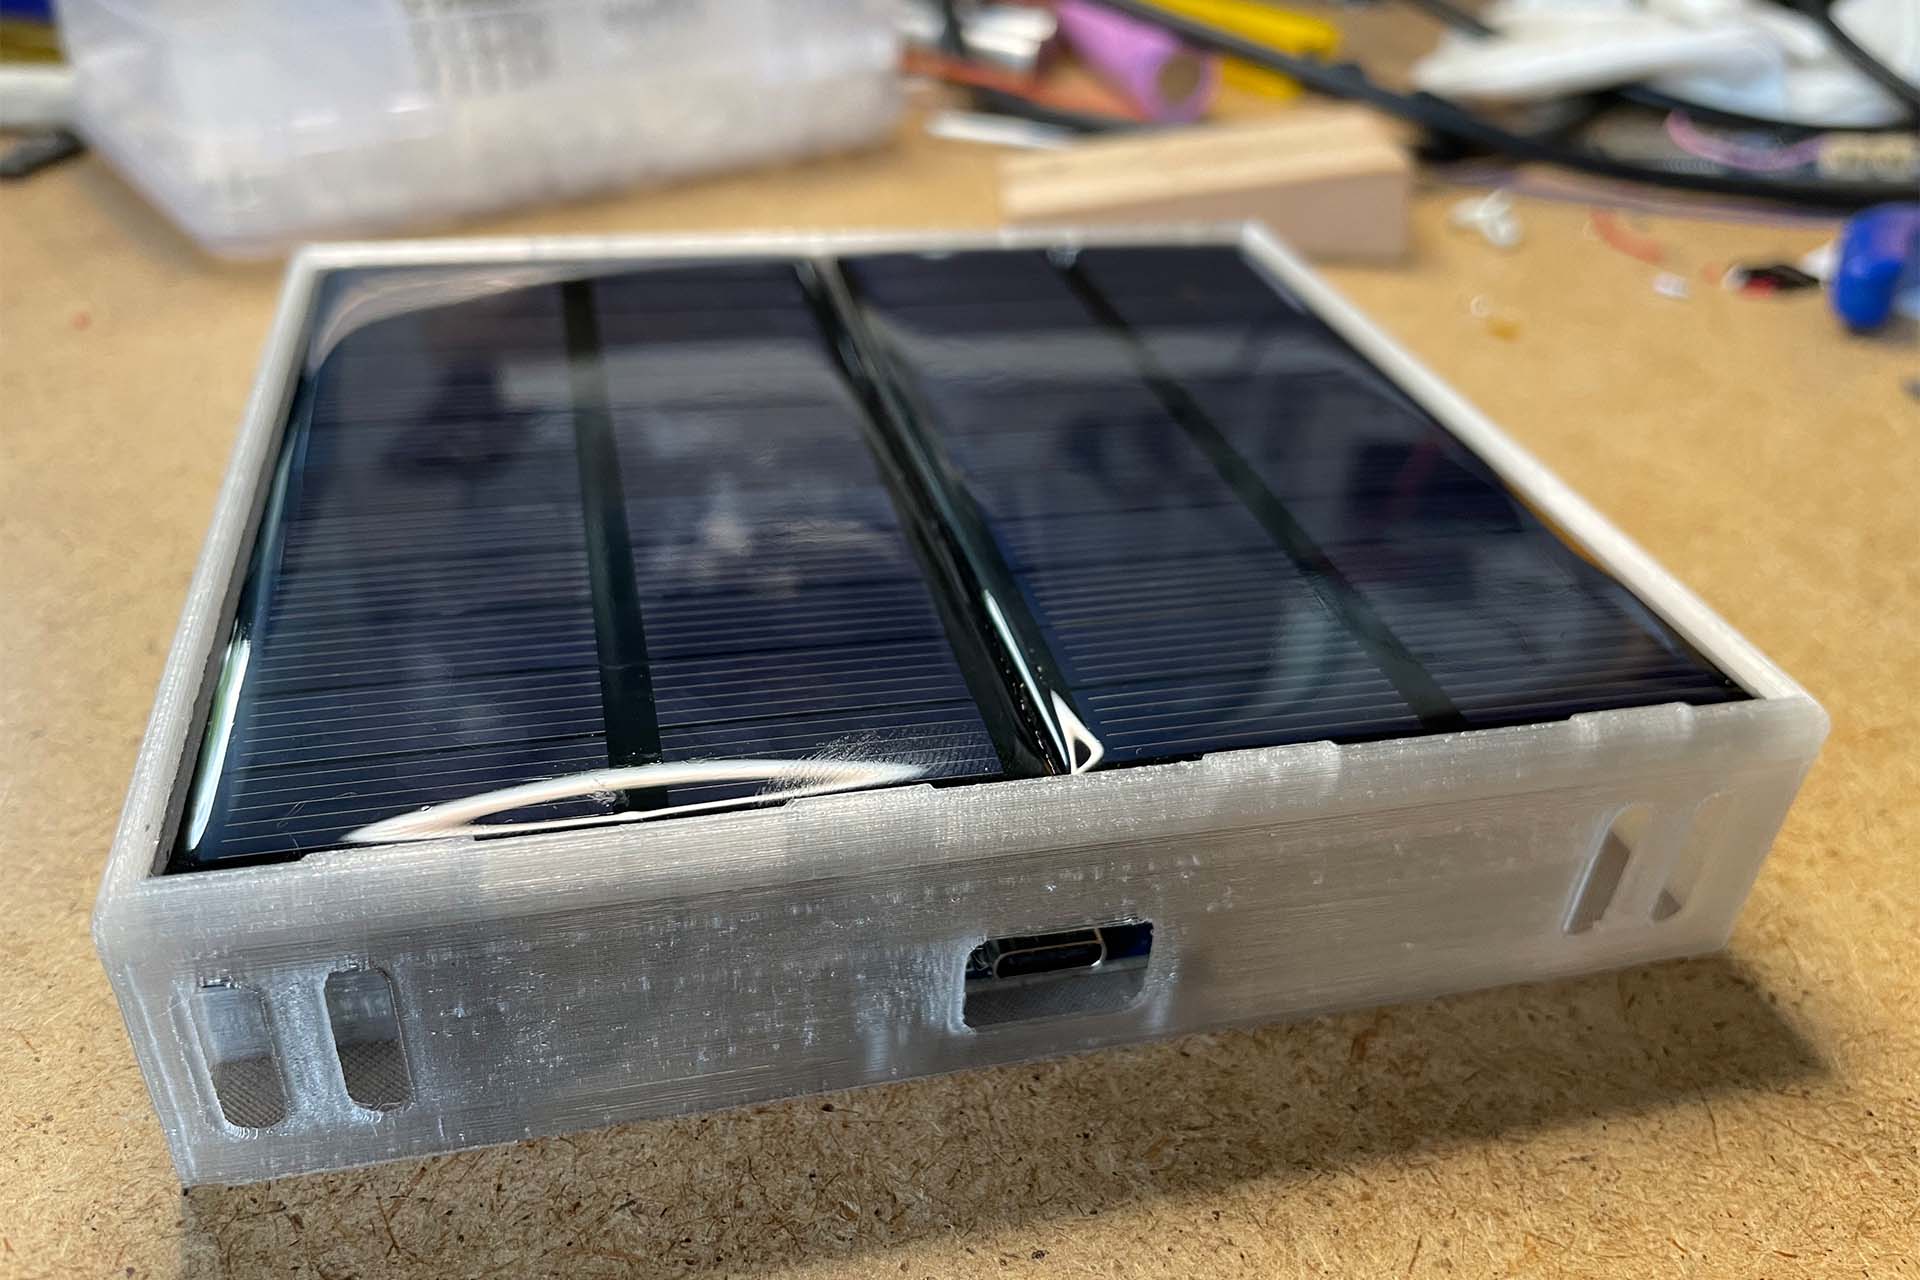
Case
The housing of the radio modules is largely identical to the previous version. Only the holes were adapted for the new board.
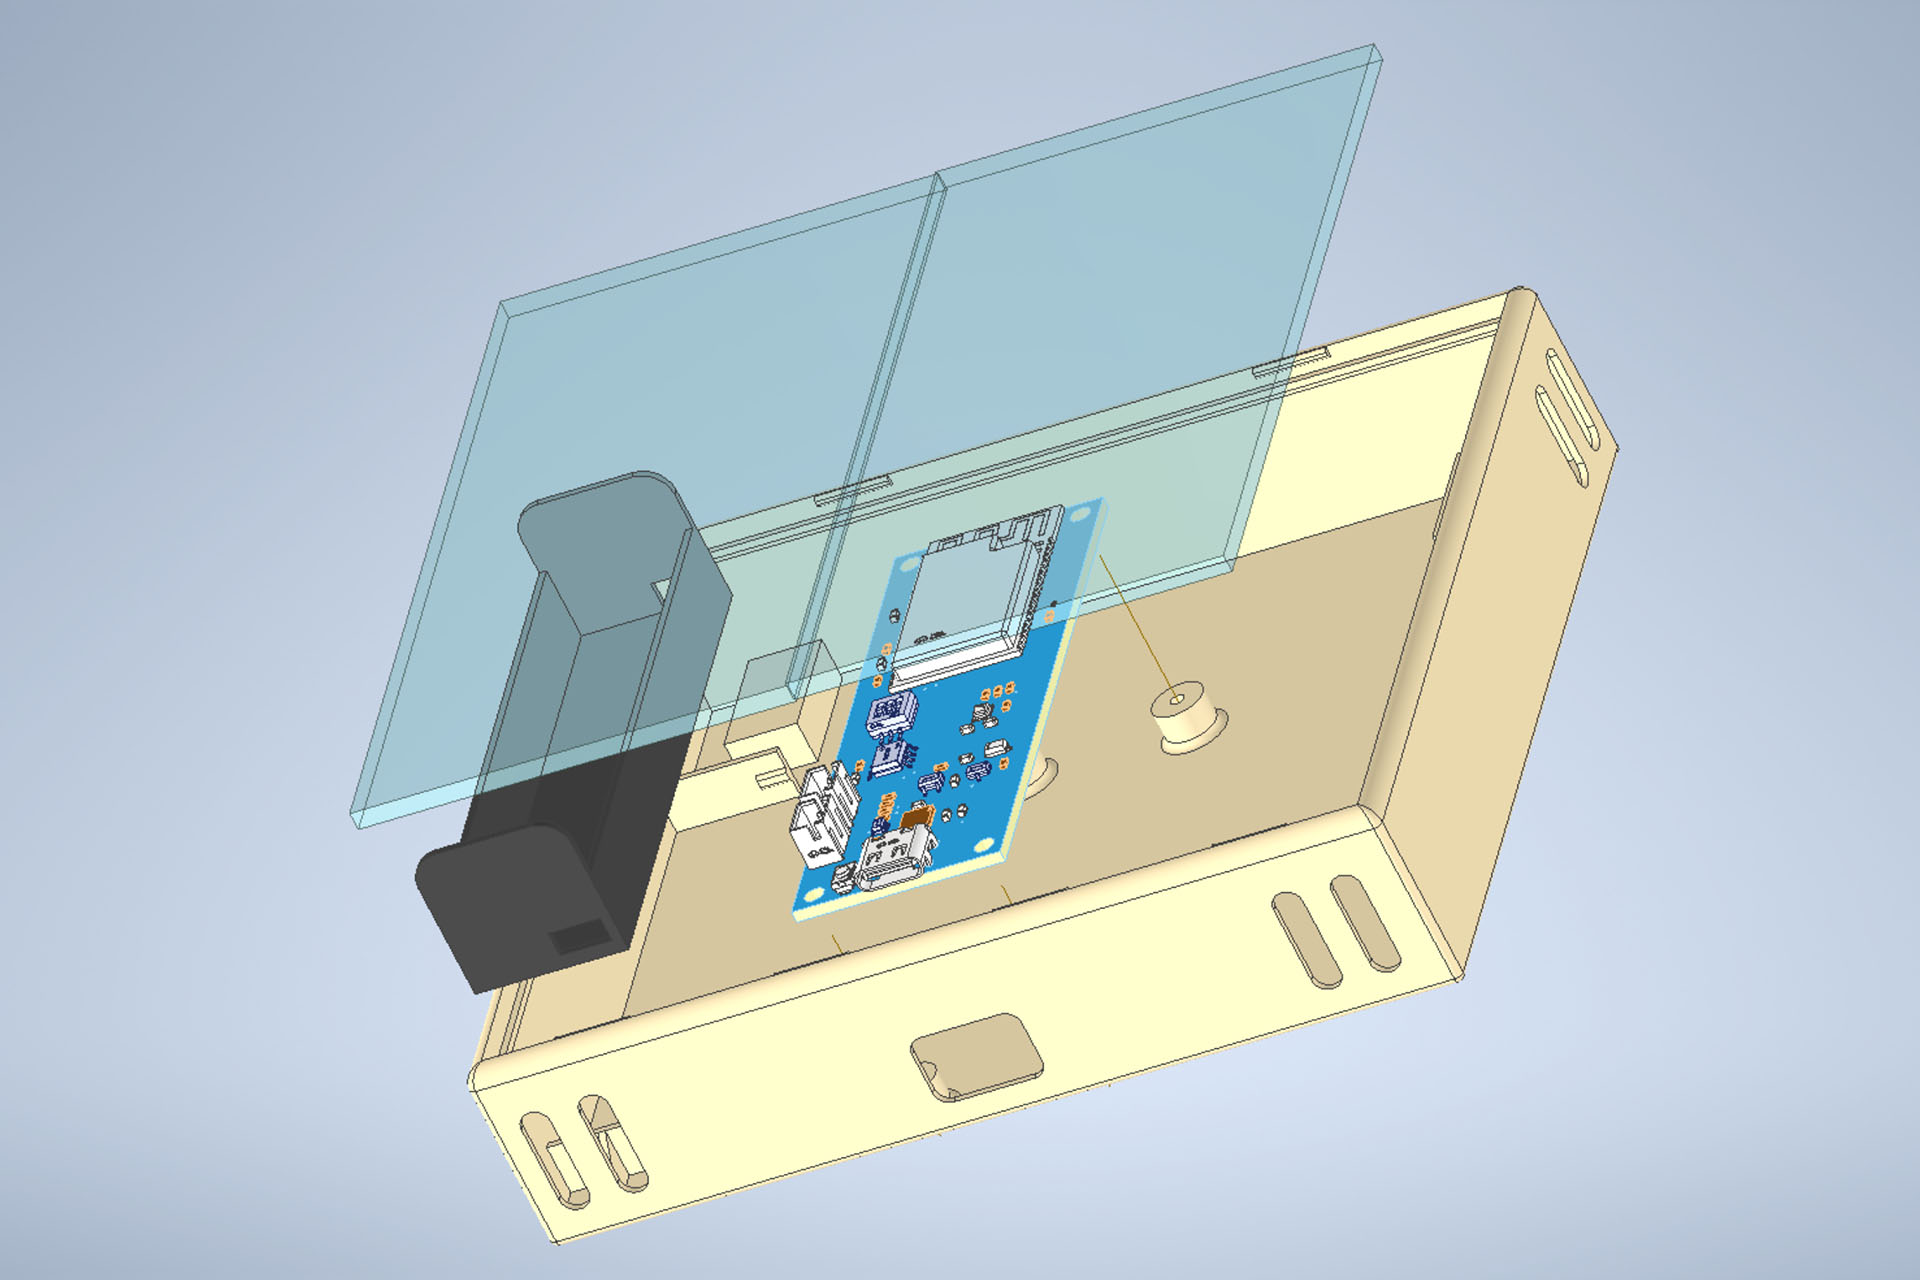
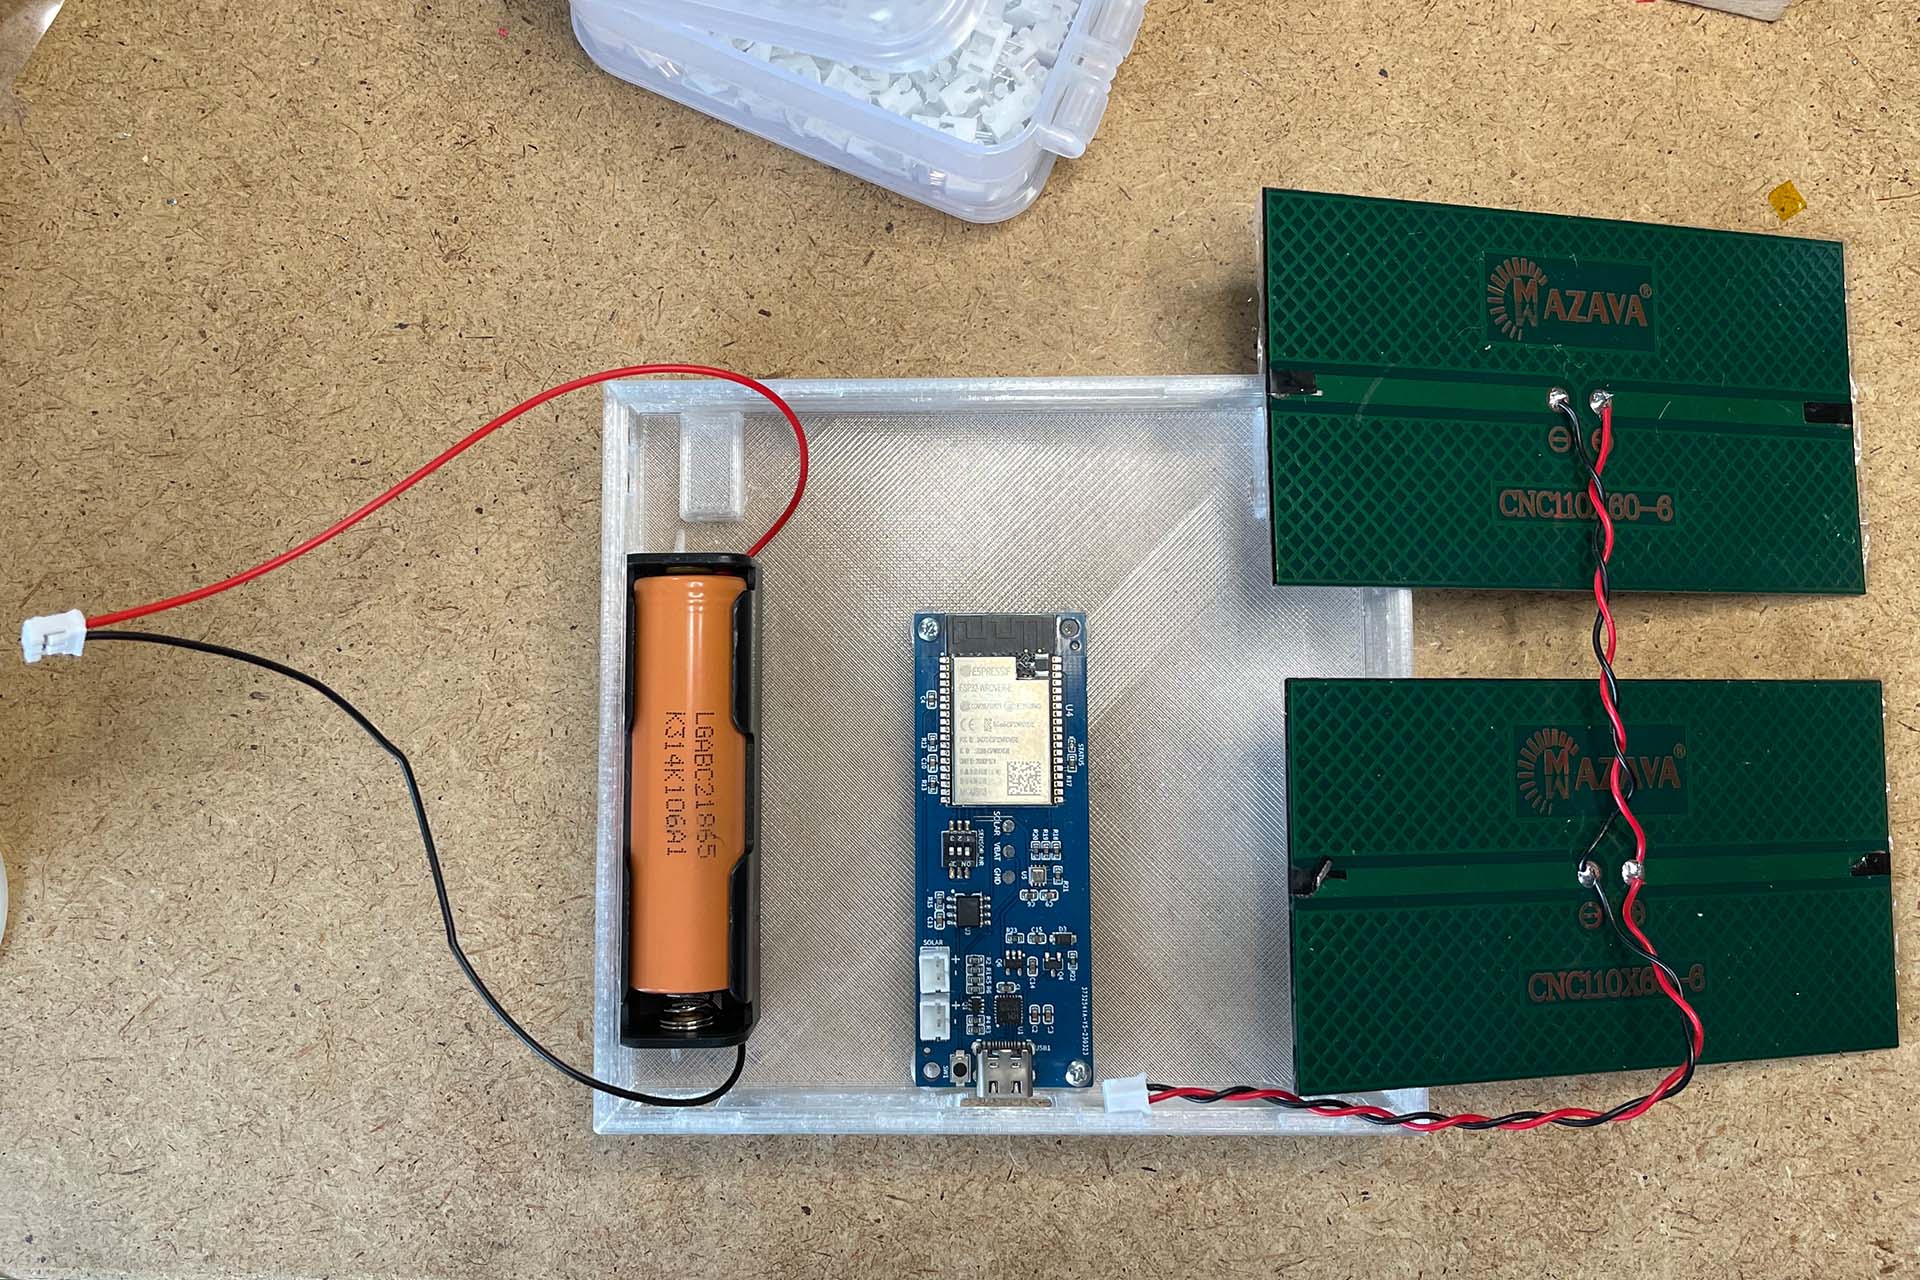
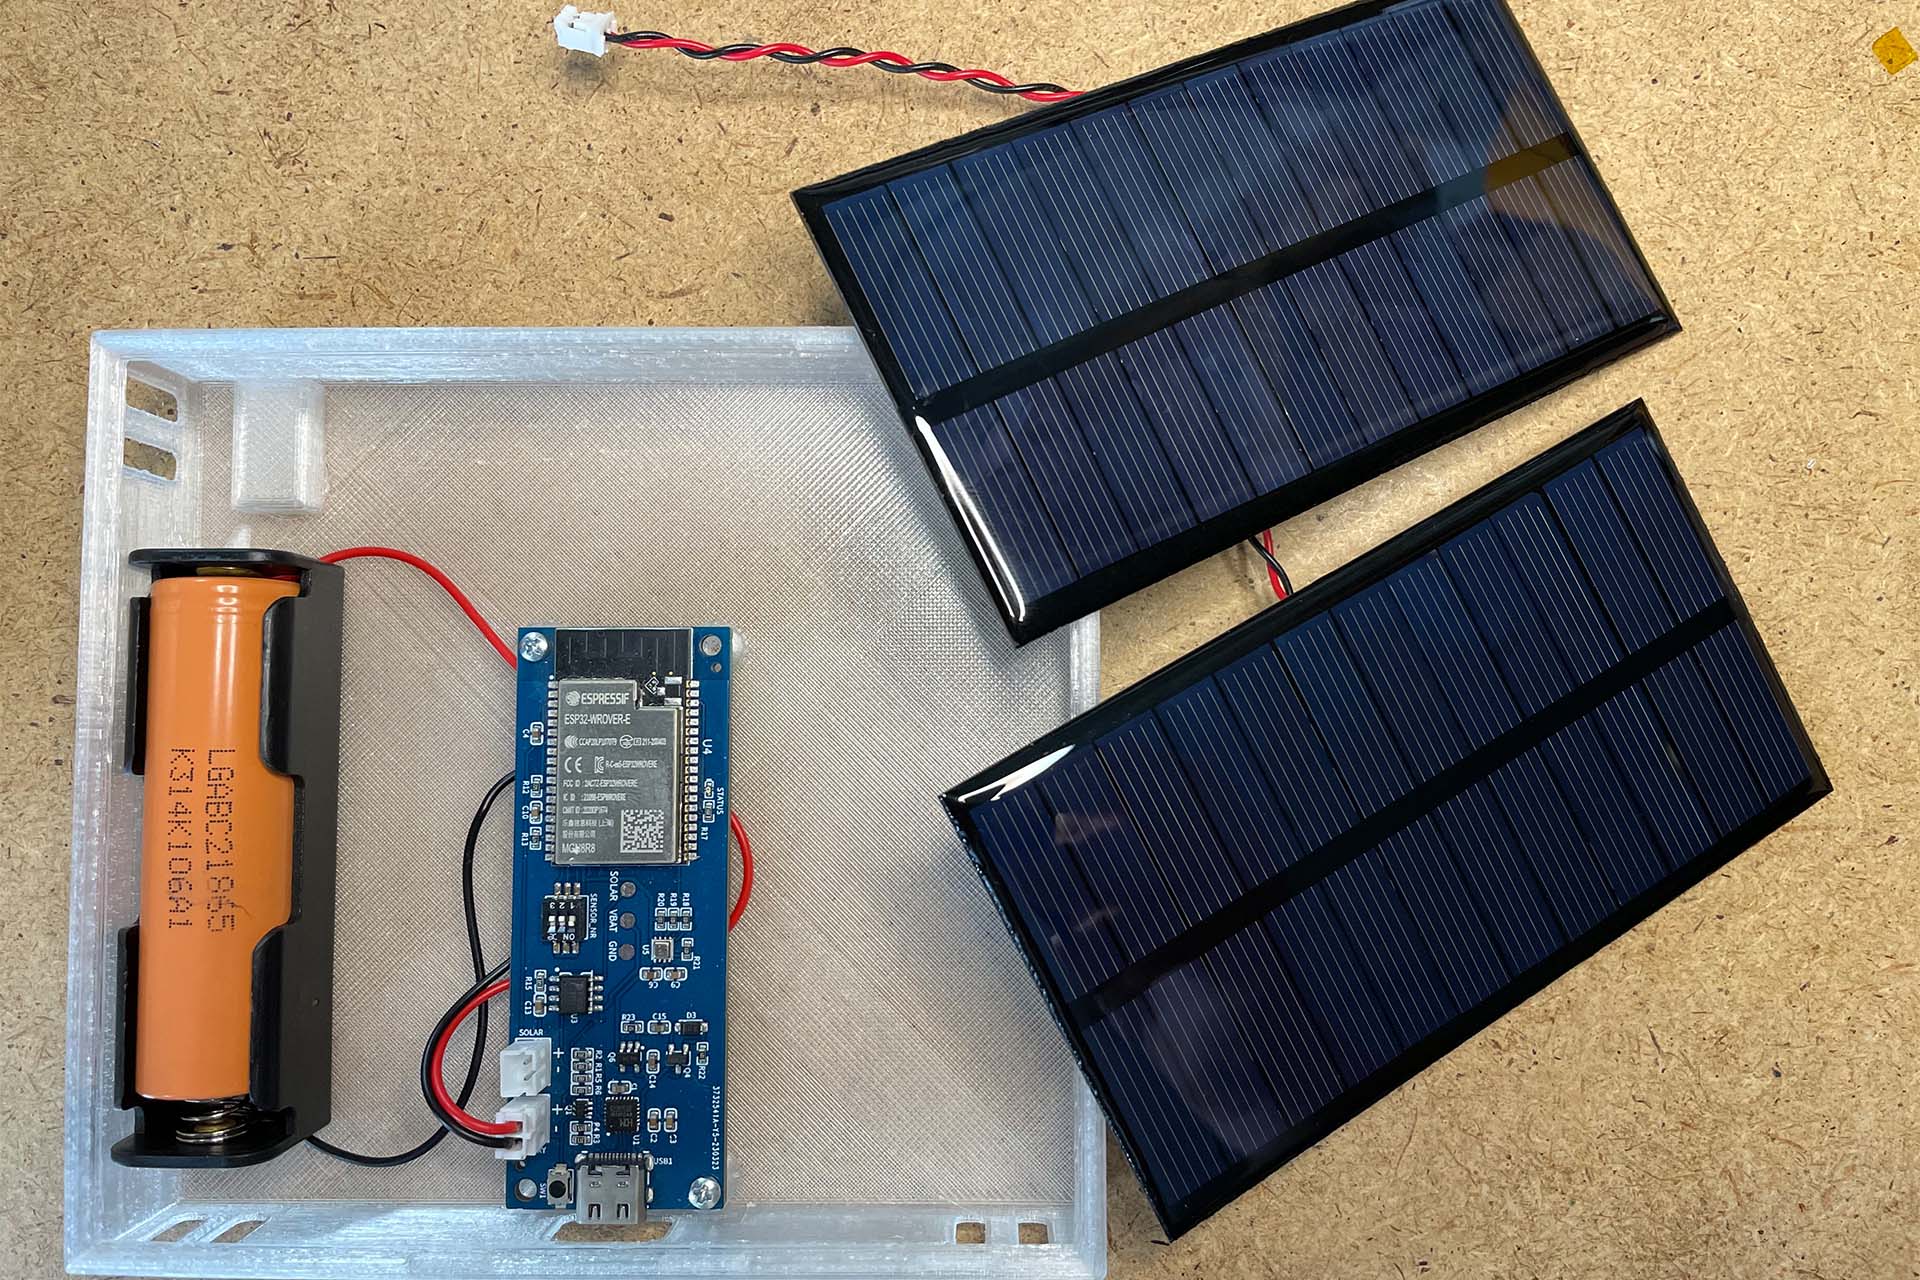
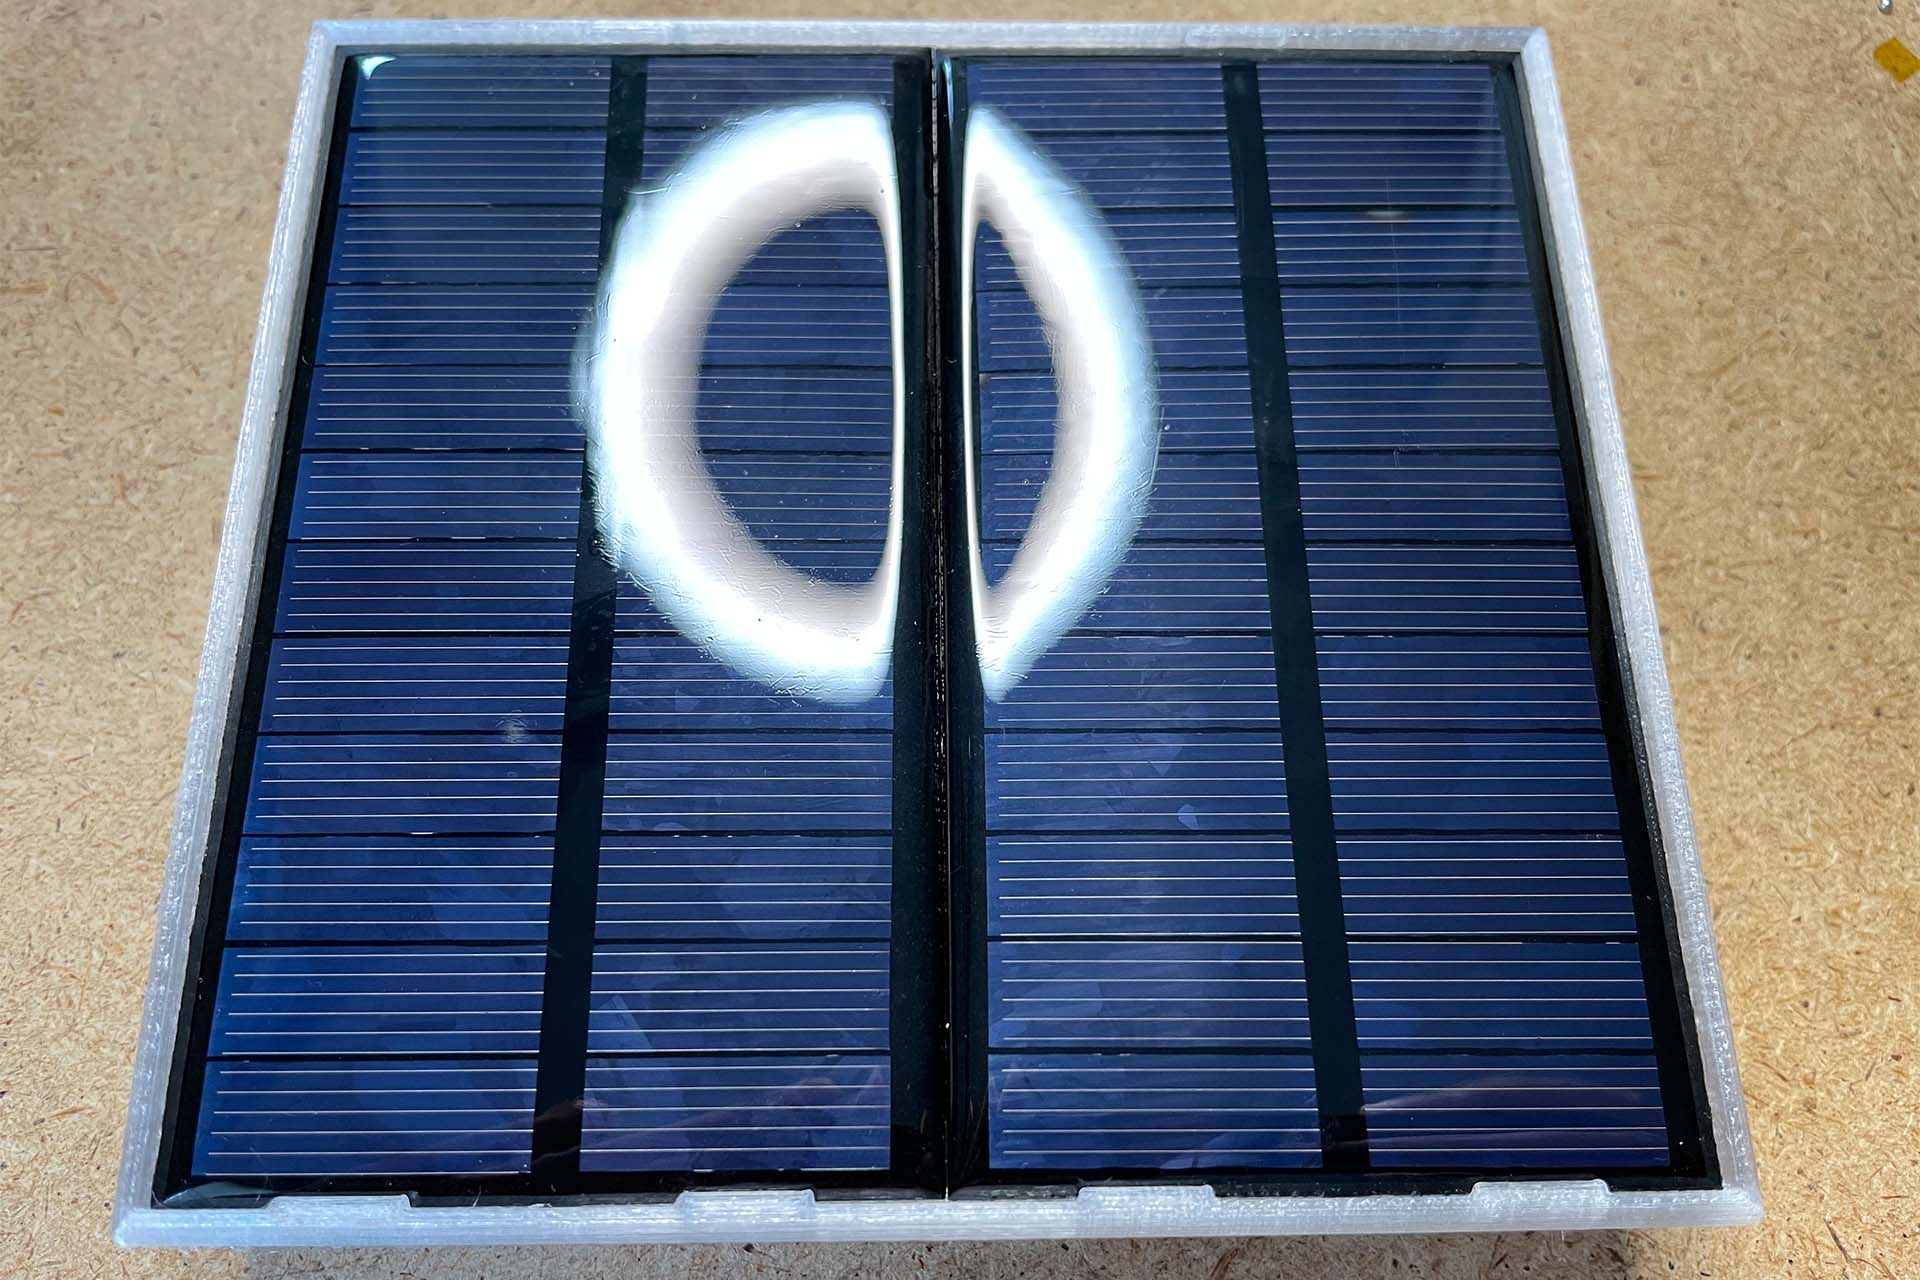
Currently, I have only designed a case for two solar cells. With the low power consumption of the new ESP32 boards, one solar cell would have been enough, or maybe a version without solar cells and you just change the battery when needed. But now the charging electronics is included, so I want to use it.
The STL files for printing are on GitHub.
Conclusion
Again I learned a lot, especially about GUI programming with LVGL. In the meantime there is not much more I could improve about it. The weather station has become an integral part of my everyday life and I don't want to miss it anymore.
But I could still improve a few small things:
- Setup screen to be able to enter geo-coordinates, WLAN password and the OpenWeather API key.
- Transfer the data to a server to be able to display it with the smartphone.
- OTA Update
- Larger display to be able to show the data a bit clearer and more readable, I just haven't found one yet.
I would be very happy about feedback. Even more, if you would support me in the further development.