Build Guide for an ESP32 Weather Station & Environmental Monitor
Almost exactly two years ago I published the article about the Weather Station 2.0. So it's high time for an update. In this article I would like to introduce version 3.0 to you. The preliminary work began some months ago, when I was busy with the topics of LoRa and larger displays. The project has become quite complex in the meantime, but I will try to describe the construction and the way it works as precisely as possible, so that a rebuild is fundamentally possible.
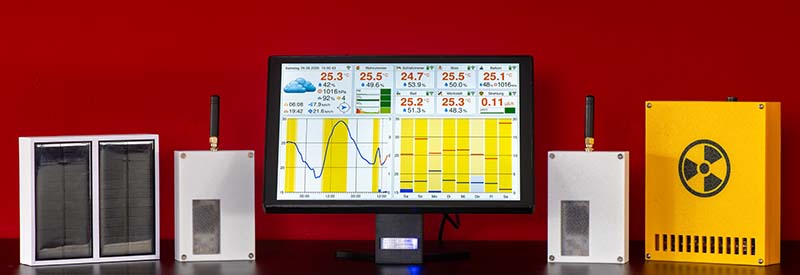
This article is, however, only a snapshot of the project, because the weather station is continuously evolving. For really important changes I will update the article accordingly, but otherwise please don't be surprised if there are small differences here and there between the description here and the current state on GitHub.
I would like to begin with a list of everything the ESP32 Weather Station & Environmental Monitor can do.
Base station
- ESP32-P4 with 10.1 inch display
- Enclosure from the 3D printer
- Display brightness adapts automatically to the surroundings
- Display dims automatically when nobody is nearby
- Sensirion air quality sensor provides temperature, humidity, VOC index, particulate matter, NOX and CO2 values
- Layout supports up to 6 sensors simultaneously
- 24h history charts for all air quality values
Wireless sensors
- ESP32-based, supports the ESP-NOW and LoRa radio protocols
- ESP-NOW sensors connect fully automatically to the base station
- Very low power consumption thanks to deep sleep mode
- The battery can optionally be charged via solar cells
- Each sensor can send different data (temperature/humidity, air pressure, even a Geiger counter for radioactivity). New sensor types can be integrated easily.
- Each sensor slot can be individually labeled in the setup with a name and an icon from a catalog (kitchen, bedroom, balcony, ...)
- Offline detection: a sensor slot is marked red if no signal has been sent for a longer period of time
Weather forecast
- Detailed forecast for the coming 48 hours and 7 days respectively
- Three weather APIs to choose from: Open-Meteo, OpenWeatherMap and Visual Crossing
Software & operation
- Setup screen for configuring the weather station
- Switchable language, currently German and English
- Automatic OTA updates via GitHub Releases, with rollback protection in case an update fails
What I have quite deliberately not integrated is any kind of cloud services or mesh functionality. The weather station works purely locally (apart from the weather data, of course) and is therefore not dependent on any further services.
The build guide is divided into the following points:
- Basic construction
- Software architecture
- Application screens
- Environmental sensors
- Display sensors
- Integrating a new sensor type
- Weather APIs
- Base station hardware
- Enclosure and assembly of the base station
- Radio modules
- Costs
- Conclusion
The basic construction of the ESP32 weather station
The central component of this weather station is the 10.1 inch display from Waveshare. With its ESP32-P4 microcontroller, flickering and shifted pixels like on the earlier ESP32-S3 boards are finally a thing of the past on this display, since the ESP32-P4 has both a fast 2-lane MIPI-DSI interface and the performance needed to send the data to the display quickly enough.
However, the ESP32-P4 has no hardware whatsoever for Bluetooth or Wi-Fi. Therefore it is usually paired with an additional microcontroller such as the ESP32-C6. Since this would make software development considerably more difficult, Espressif has developed a special software component called esp-hosted-mcu, which handles the communication between the two microcontrollers in the background, and the developer can continue to use the usual API calls of the ESP-IDF framework. With one exception. ESP-NOW is to this day not supported by esp-hosted. This protocol is, however, essential for the sensors, which is why there is now a dedicated receiver based on a Heltec LoRa 32 V4. As a result, the receiver supports both the ESP-NOW protocol and the LoRa radio protocol. The ESP32-C6 on the display board handles access to the Wi-Fi in order to fetch the data from the weather APIs or to load new firmware.
The brightness of the display is controlled via a BH1750 light sensor and a C4001 radar sensor. The radar sensor determines whether anyone is nearby at all and switches the display dark if not. In the presence of a person, the BH1750 controls the display brightness depending on the surroundings. These two sensors also communicate with the ESP32-P4 via the I2C interface.
The measurement of the air quality is carried out by the new SEN66 from Sensirion. Besides temperature and humidity, this sensor can also measure particulate matter, carbon dioxide, nitrogen oxides and VOC. The design is thereby simplified a little, because two sensors as before are no longer necessary. This sensor, too, communicates with the ESP32-P4 via the I2C interface.
Software architecture
The project was developed with the current ESP-IDF Framework version 6.x. The graphical output is based on LVGL 9.5. The design of the layout was created with EEZ-Studio.
The application consists of two screens. After startup, the setup is loaded first. After the setup, the actual application is started. As soon as this screen has been loaded, the individual tasks are started. Each area of responsibility of the application gets its own task in the process.
The following diagram gives an overview of the individual components of the base station:
The receiver takes on the task of receiving data packets from the individual sensors via ESP-NOW and LoRa and placing them on a stack. Toward the ESP32-P4 it behaves like an I2C device that can be read out via special registers. As a result, the reception of the sensor data is completely decoupled from the base station.
Sensors, receiver and base station communicate via a common packet format, which consists of a header (message type, sensor number, sensor type, length) and the actual payload structure, which can have different fields depending on the sensor type. The receiver adds RSSI and SNR and passes everything on via I2C. The payload is only evaluated on the base station, which knows from the header which sensor slot and which structure are meant.
Both boards update themselves autonomously via GitHub Releases. Each release triggers an action in which the firmware for the base station and the receiver is built. The base station checks regularly whether a new firmware version is available. When there is a new version, the base station updates first and the receiver afterwards.
User Interface
The application is quite simply structured and consists of only two screens. The setup screen and the actual weather station screen. There is no navigation back into the setup. If you want to change something, simply pull the plug briefly, then the device starts again with the setup screen.
Setup
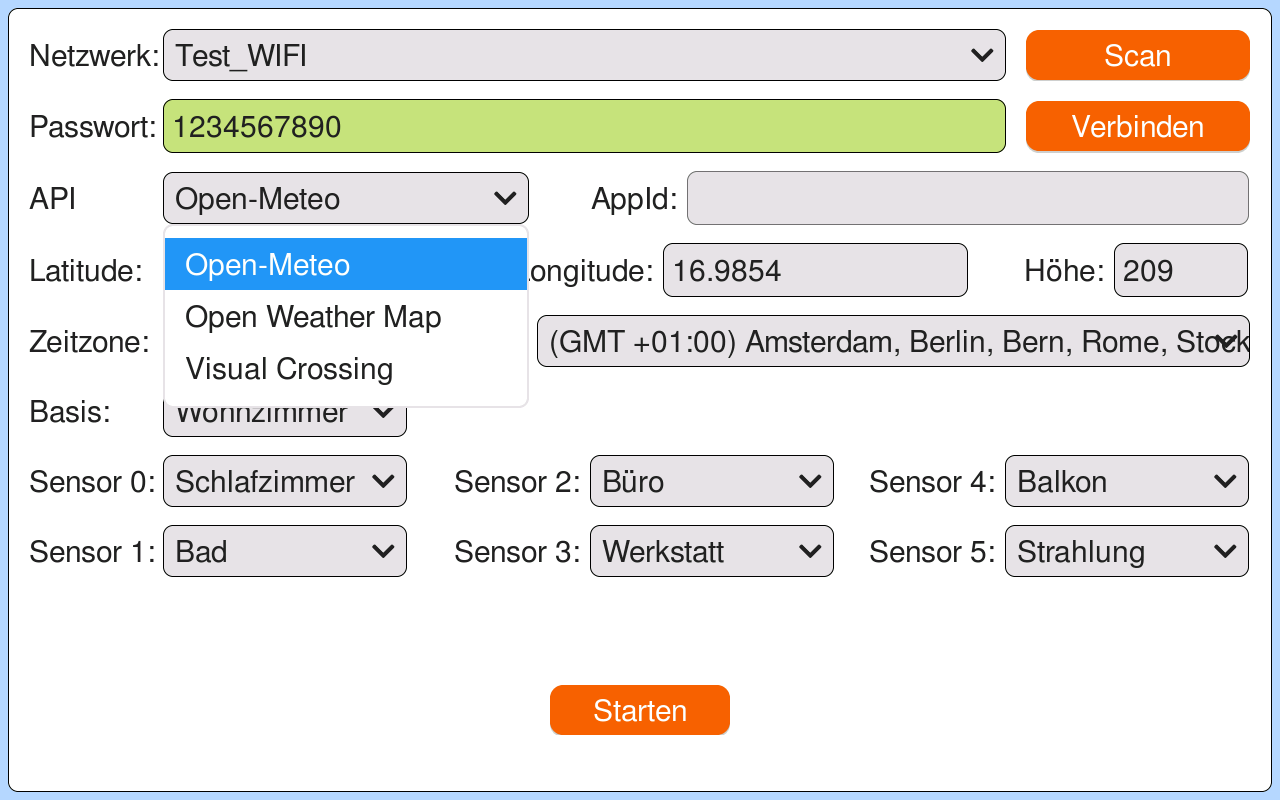
After switching the weather station on, the setup screen appears. Here the Wi-Fi access can be configured first. The Scan button searches for the available networks. In the dropdown list you can then select your own network. Once you have entered the corresponding password, the Connect button can be used to check whether a connection can be established. Should a Wi-Fi access already be stored, the system automatically checks at startup whether a connection can be established.
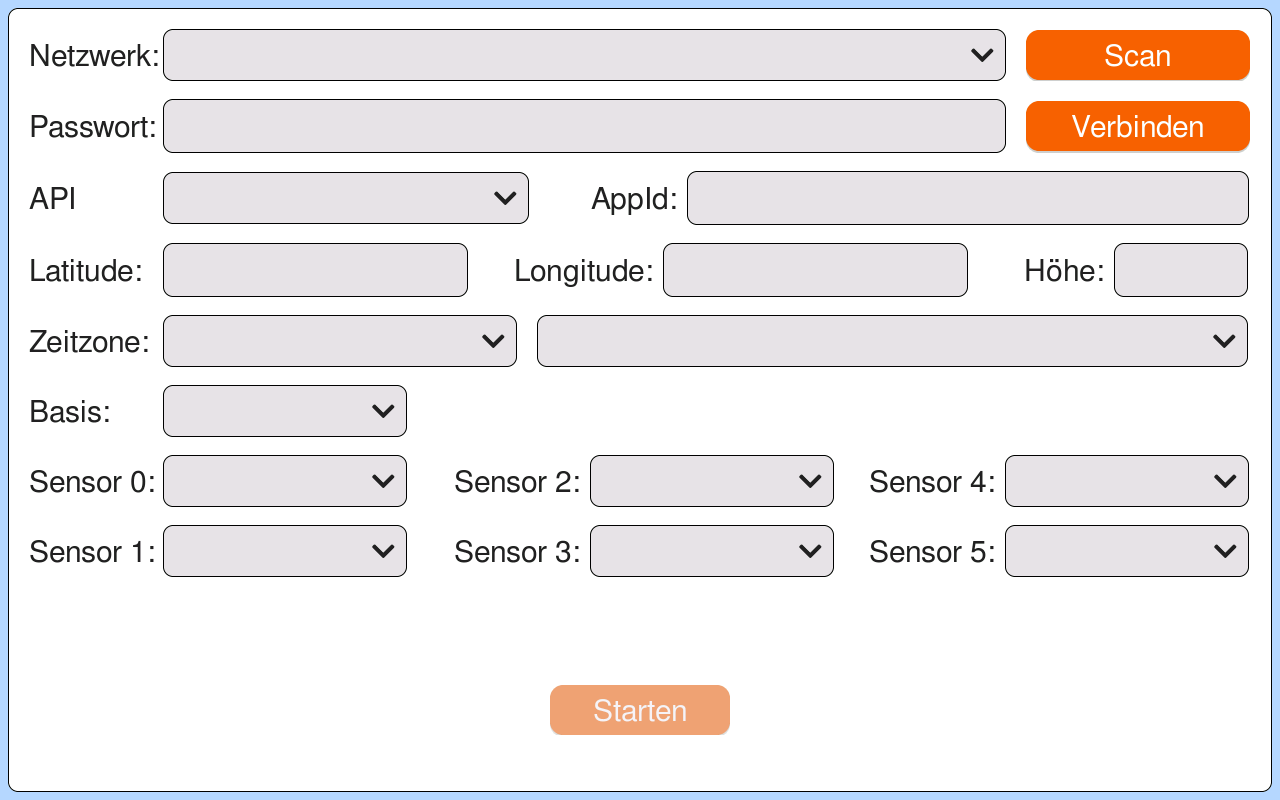
Under API you select the API provider. AppId is the respective key of the weather API you want to use. This key is only needed for OpenWeatherMap and Visual Crossing. Open-Meteo works entirely without a key.
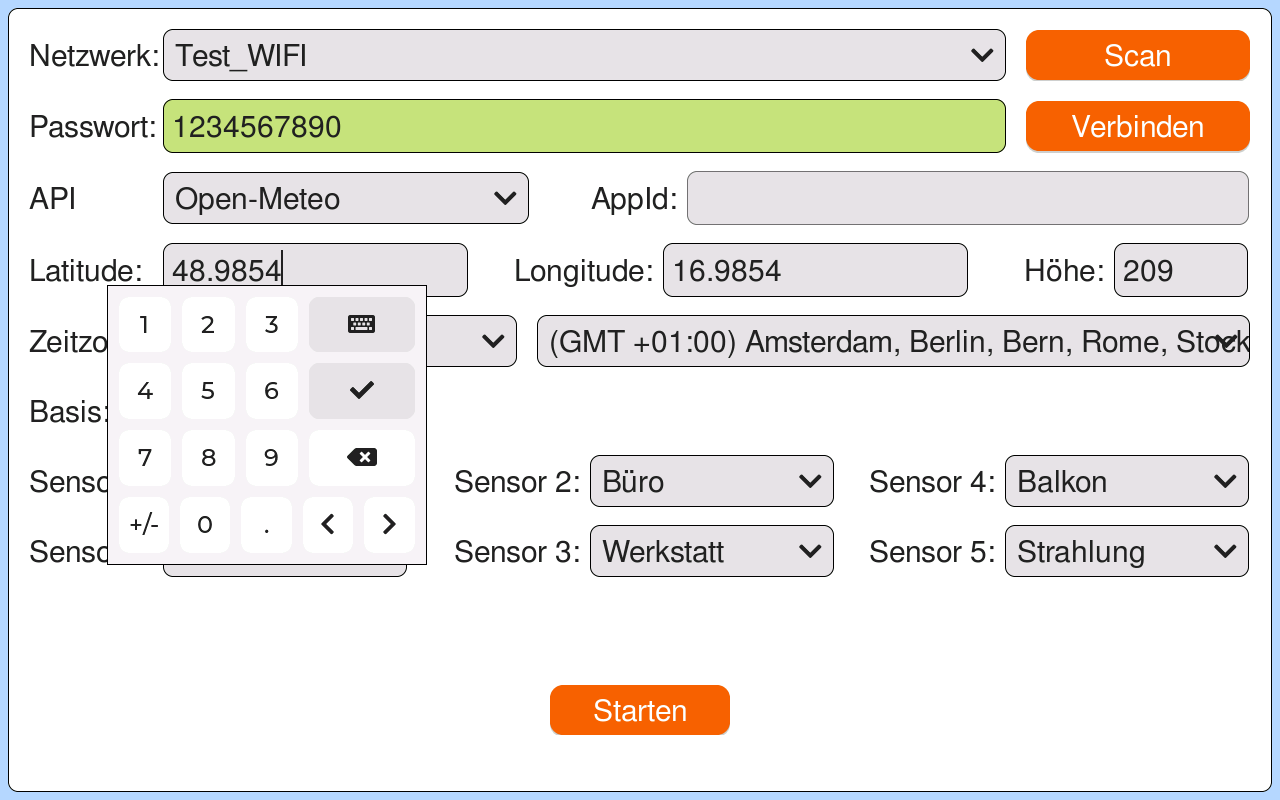
Latitude, longitude and altitude are needed for the weather APIs and for the correct conversion of the air pressure respectively.
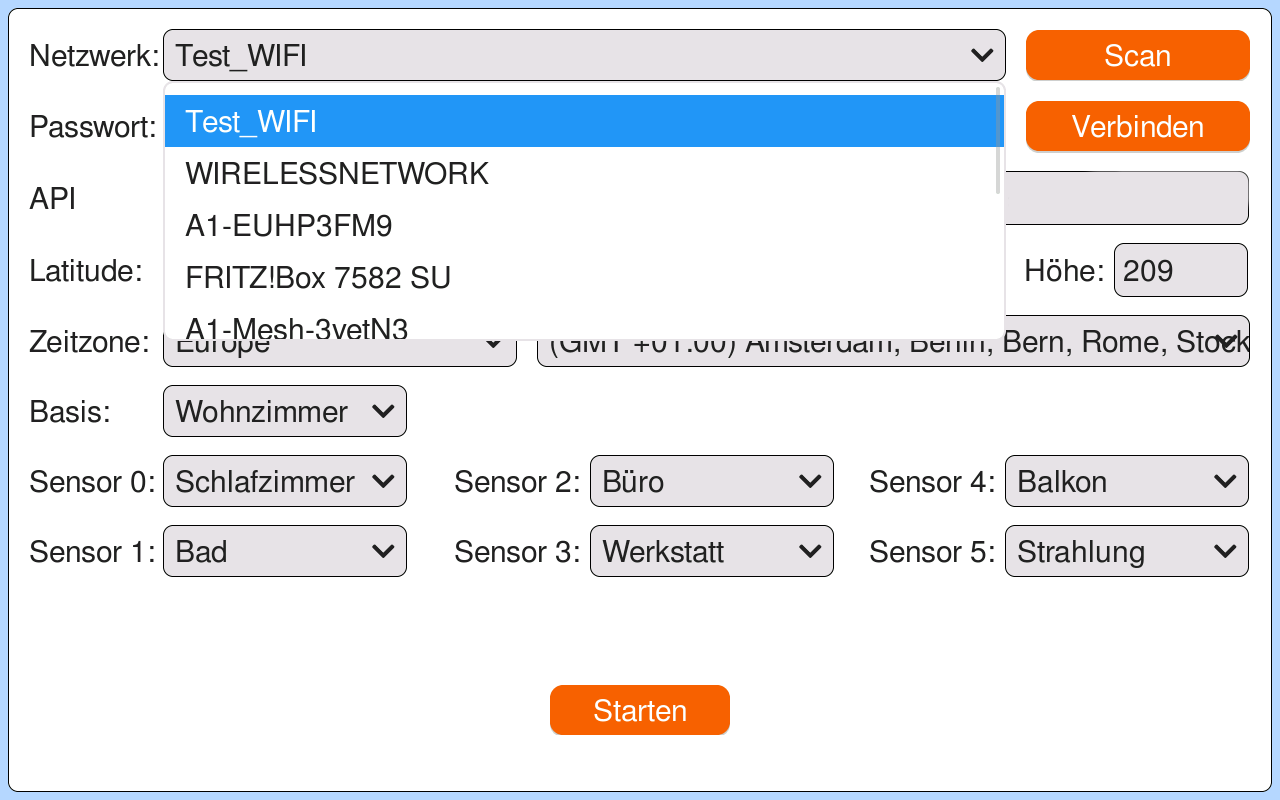
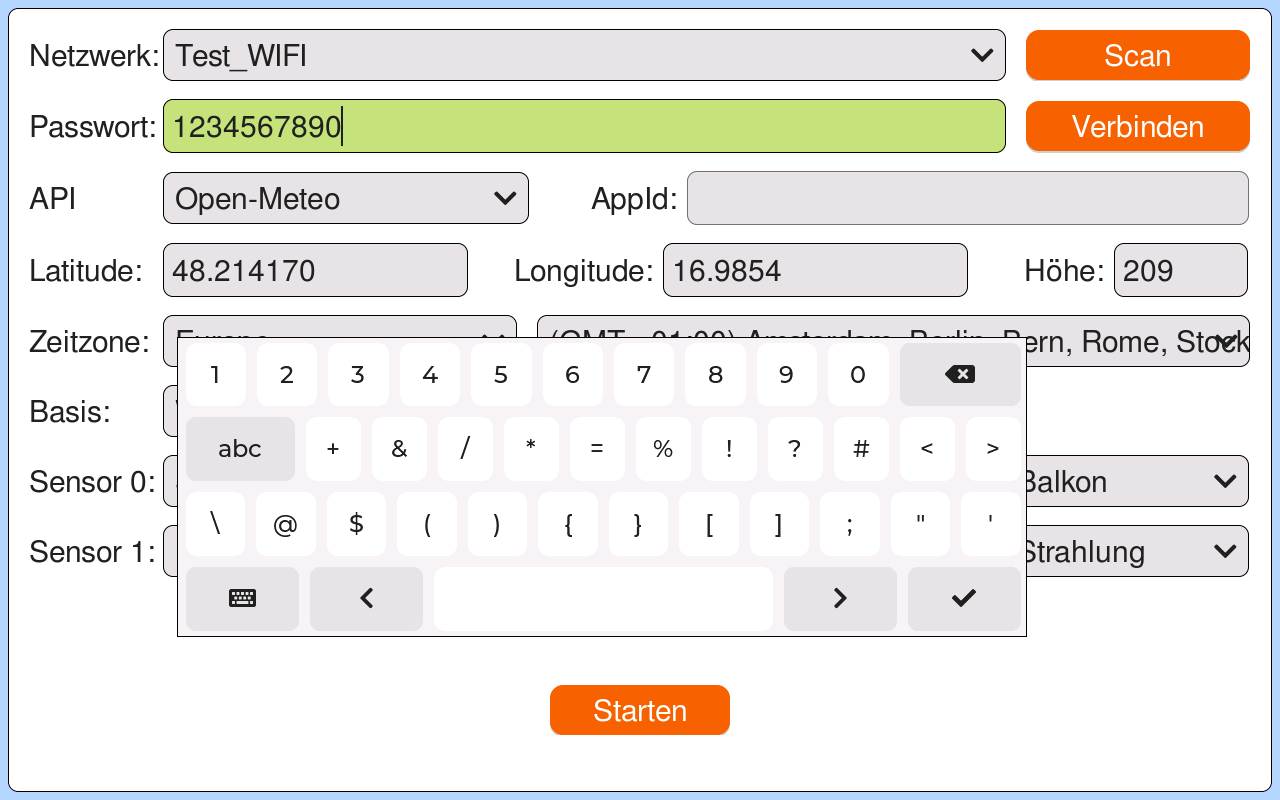
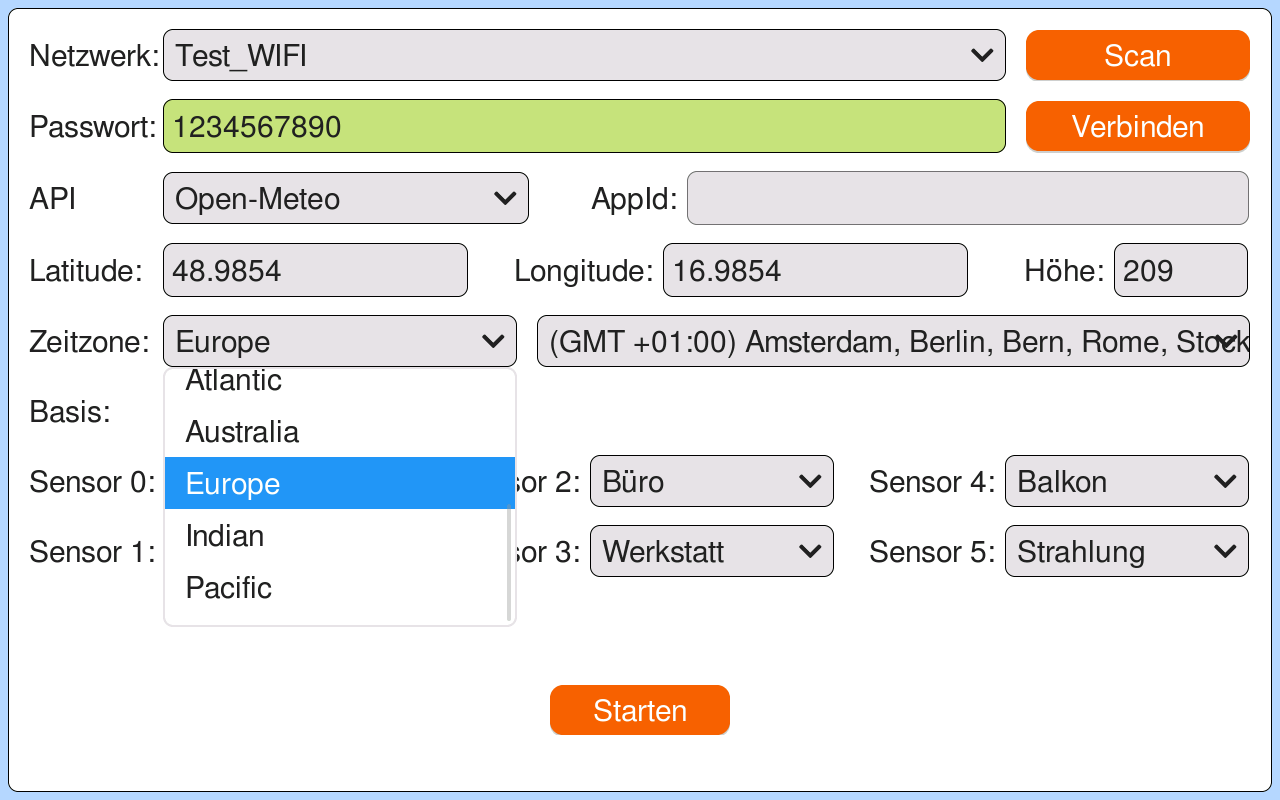
The time zone is important for the correct time. Daylight saving time is also controlled via this. I may possibly integrate a service here later that can determine the time zone automatically based on the latitude/longitude fields.
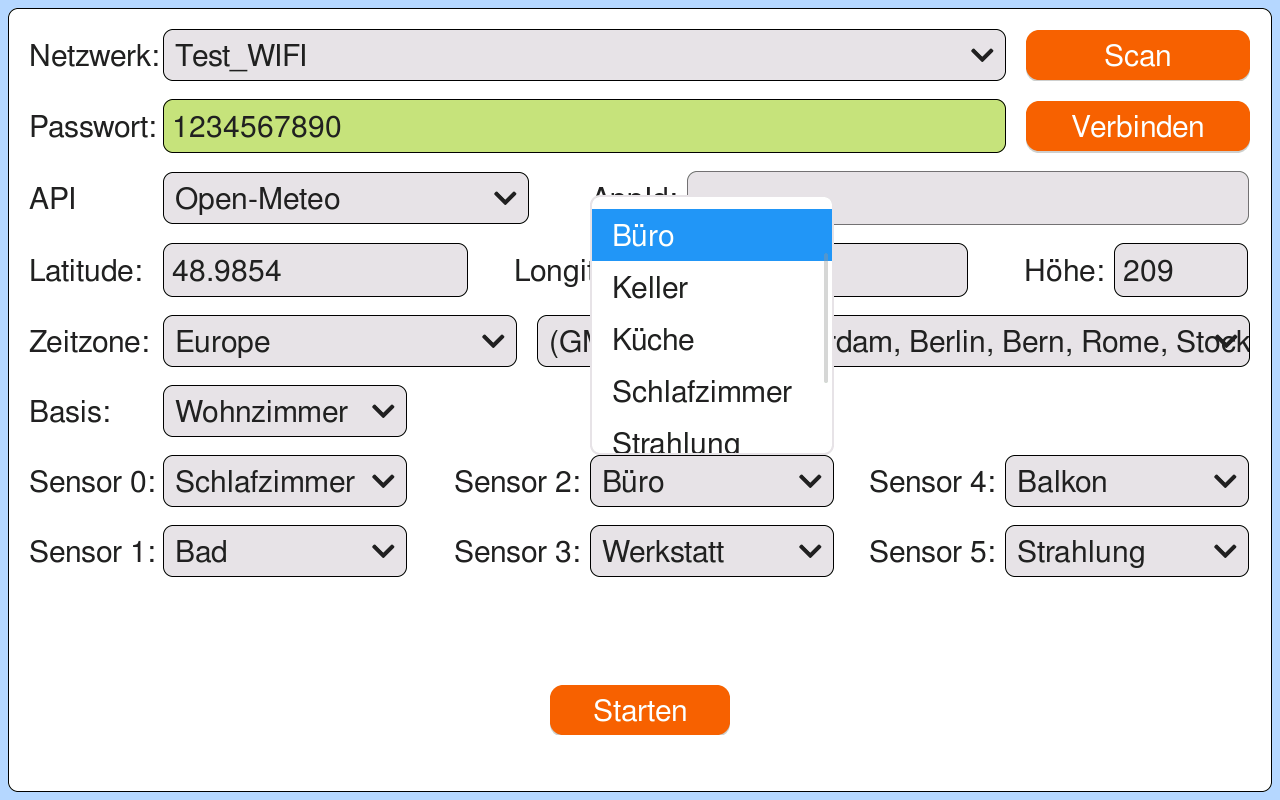
The last fields are the labels of the respective sensors and of the weather station itself. The type of sensor currently still has to be set directly in the layout in EEZ-Studio. This is due to the way EEZ-Studio generates code: all widgets of a layout are created once at startup in a static struct. The widget structure, and thus also the sensor type, can therefore no longer be changed at runtime. The only option within this workflow would be to create all possible sensor types in every slot from the outset and only make the appropriate one visible at runtime. That is, however, very cumbersome, which is why I have not implemented it. But as soon as I have a solution for this problem, I will adapt the setup accordingly.
Finally you click on Start, then it switches to the screen with the weather and sensor data.
Weather station
My goal was to display as much information as possible on the display and nevertheless remain clear and easy to read. By switching to a 10 inch display, the values of six sensors can now be shown. The following image shows all the information that is displayed on the screen.
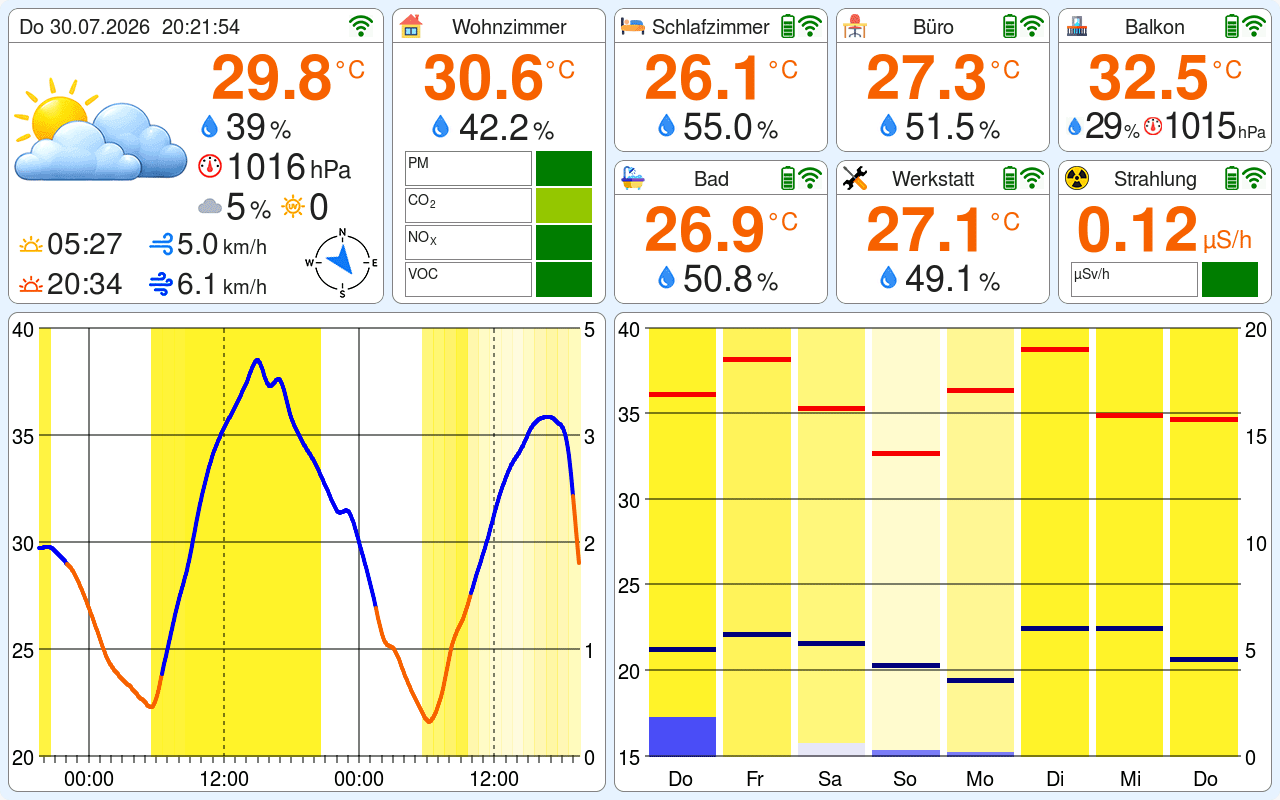
Top left and the two diagrams at the bottom are the data of the weather API. Here current values, an hourly forecast for 48 hours and a daily forecast for 7 days are displayed. At the top next to the current values, the data of the base station is displayed, and next to that the values of the sensors. The following diagrams show the areas once more with a labeling of the data.
Current weather data
Forecast for the next 48 hours
The temperature curve indicates the dew point by color. The dew point is the temperature at which the air is saturated and water vapor begins to condense. With regard to how temperature is perceived, especially mugginess, the dew point plays a decisive role:
- High dew point (above 18 °C): The air contains a lot of moisture, and sweat evaporates less easily. As a result the temperature feels noticeably warmer and unpleasantly muggy. From about 21 °C it becomes oppressive and taxing for many people.
- Low dew point (below 13 °C): The air is drier, sweat can evaporate well, and it feels more pleasant, even at high temperatures.
Of course these values are very subjective and correspond more to my personal perception of temperature.
Forecast for the next 7 days
The temperature scale adapts dynamically to the highest and lowest values. The precipitation amount, on the other hand, is shown on a fixed scale, in order to be able to recognize at a glance whether it is raining a lot or a little. For the hourly forecast I set the maximum value to 5 mm, while for the daily forecast it is 20 mm, since it rarely rains or snows more than that. In the future I could possibly make these values configurable in the setup.
Base station data
The SEN66 can measure four different particle sizes, which is why the upper bar is again divided into four small bars. The bottom bar corresponds to PM1 and at the very top is PM10.
Besides the current value, the history over the last 24 hours is also displayed. Since PM actually has four values, I use the PM2.5 value for the history.
Sensor data
At the moment there are three different sensor types. For each type a separate user widget is implemented in EEZ-Studio. In the base station code it is defined which sensor type is displayed with which user widget. The header row is structured identically for all sensor types and shows icon, name, battery status and signal strength. The color of the header row indicates whether a sensor is offline. For this the receiver stores, for each sensor, the time interval between the data packets and marks the sensor as offline if the interval is more than three times the usual time.
It is also possible to use several user widgets per sensor type. For example a widget for the BME280 that only shows temperature and humidity, or a larger widget that shows humidity and air pressure one below the other. Here there are hardly any limits to your imagination.
Software update
Every hour a check is made whether there is a new version on GitHub, and if so, a corresponding popup window is displayed.
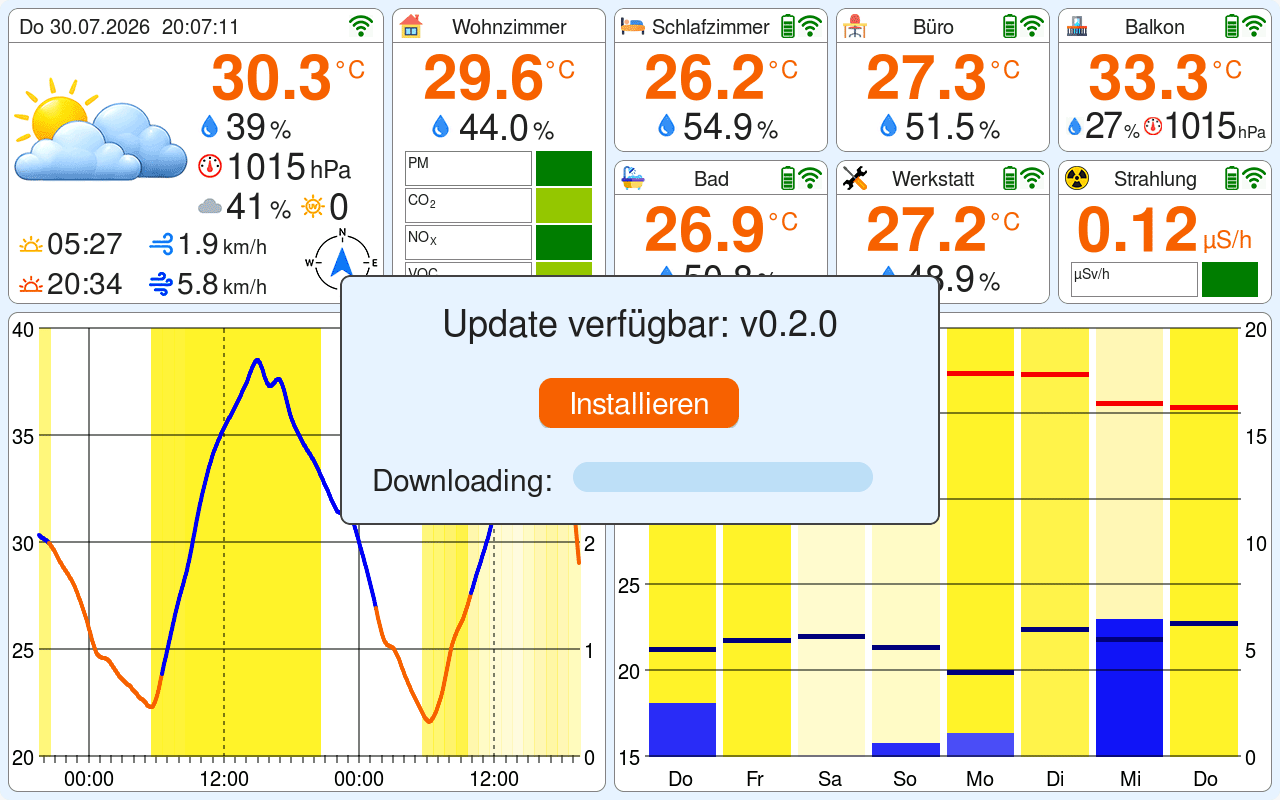
After the download, the firmware of the base station is updated first and then the firmware of the receiver. Should something not work during the update, it automatically switches back to the previous firmware.
The environmental sensors used
In the weather station, exclusively high-quality sensors are used, since with all this effort it would not be very smart to save money in the wrong place. Primarily I rely here on the high-precision sensors of the Swiss manufacturer Sensirion. The setup is complemented by the proven BME280 sensors, which I have used on my self-designed sensor board.
Sensirion SEN66
The SEN66 is a new environmental sensor from Sensirion for measuring particulate matter (particles), volatile organic compounds (VOC), nitrogen oxides (NOX), carbon dioxide (CO2), relative humidity and temperature. The laser-based particle sensor measures particulate matter of the categories PM1.0, PM2.5, PM4.0 and PM10.0. The NOX and VOC measurement is done via metal-oxide gas sensors (MOX), the CO2 concentration via a photoacoustic sensor module. Communication with the microcontroller runs via I2C. A quite essential improvement for me is the supply voltage of 3.3 V, in contrast to the earlier 5 V on the SEN55. Therefore no additional wire has to be soldered onto the display anymore, as was the case with the previous weather stations.
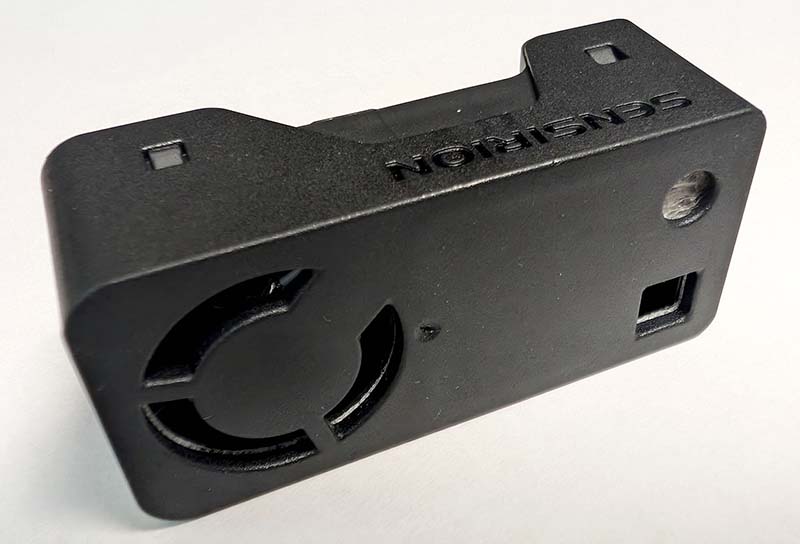
Besides the mass concentrations, the sensor also outputs the particle number concentration, in the range from PM0.5 to PM10.0. Thanks to Sensirion's patented sheath flow technology, the particle sensor remains maintenance-free and protected from dust deposits for over 10 years. An on-chip temperature compensation compensates for the waste heat of the display and the microcontrollers in real time.
Through the combination of six different parameters in a single device, the SEN66 is therefore excellently suited for the weather station, in order to monitor the indoor air quality. The wide range of the particulate matter measurement in particular can register a multitude of particles in the ambient air. The following overview shows some examples of particulate matter particles and their size:
Some important key data of the SEN66:
- Supply voltage: 3.15 V to 3.6 V
- Power consumption:
- Idle mode: approx. 3.3 mA
- Measurement mode: on average 90 mA (maximum 110 mA)
- Peak current: up to 350 mA (during the short pulse phases)
- Measurement ranges:
- Temperature: +10 °C to +40 °C recommended operating range (typical accuracy ±0.45 °C)
- Humidity: 20 % to 80 % RH recommended operating range (typical accuracy ±4.5 % RH)
- Particulate matter: 0 to 1000 μg/m³
- CO2: 0 to 40,000 ppm
- VOC / NOX index: 1 to 500 index points
- Service life: > 10 years in continuous operation
Sensirion SHT45
The SHT45 is a temperature and humidity sensor of the SHT4x series from Sensirion. It is designed for applications that require high measurement accuracy together with low energy consumption. The sensor is based on Sensirion's CMOSens technology. The physical sensor element and the digital signal processing (A/D converter, calibration memory and I2C interface) are integrated on a single silicon chip (CMOS/MEMS).
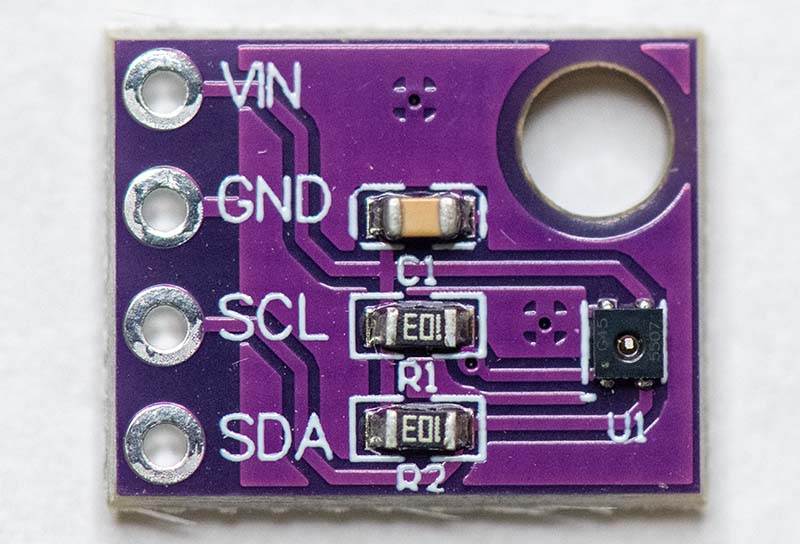
The humidity measurement is done according to the capacitive principle. The sensor element is a dielectric polymer that absorbs water from the air or releases it again, proportionally to the relative ambient humidity. This change in the water concentration influences the dielectric constant of the polymer, which is captured electronically as a change in capacitance. The temperature measurement is realized directly on the silicon chip via integrated bipolar transistors.
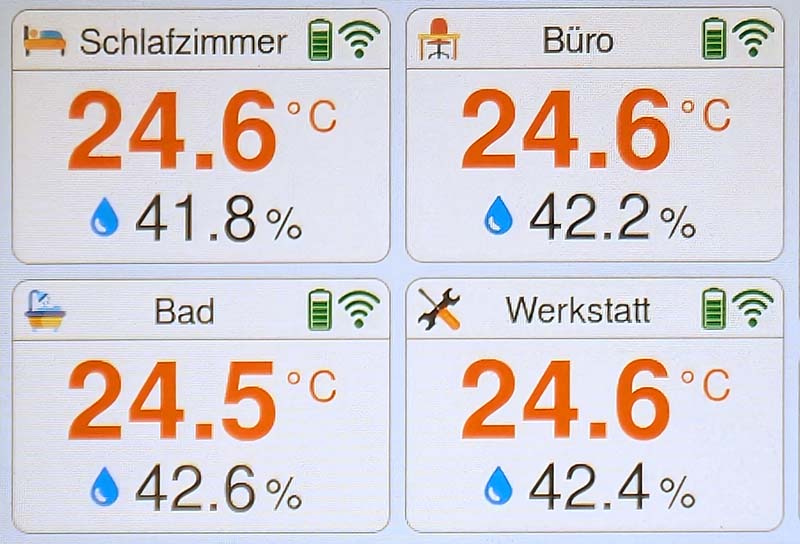
The following image shows quite impressively the accuracy of the SHT45 sensors. The image was taken after four sensors had lain next to each other for a few hours.
The module has an integrated microelectronic heating element that can be activated via I2C command in three power levels (20 mW, 110 mW or 200 mW) for 0.1 or 1 second. This primarily fulfills three functions:
- Removal of condensation: evaporates liquid moisture from the sensor surface in order to restore the measurement capability after dew or fog formation.
- VAvoidance of measurement deviations: counteracts temporary measurement deviations that can arise in capacitive sensors due to prolonged high humidity (>90 % RH).
- Decontamination: supports the outgassing of volatile organic compounds (VOCs) from the sensor polymer after a chemical contamination.
The following block diagram shows the structure of the sensor:
Some important key data of the SHT45:
- Accuracy: typical tolerance of ±1.0 % RH for the humidity and ±0.1 °C for the temperature.
- Measurement range: 0 to 100 % RH as well as −40 °C to +125 °C.
- Interface: I2C (Fast Mode Plus) with CRC checksum.
- Supply voltage: 1.08 V to 3.6 V.
- Power consumption:
- Average: 0.4 µA (at 1 Hz measurement rate in the lowest mode).
- Idle state: 80 nA.
Bosch Sensortec BME280
The BME280 is an environmental sensor developed specifically for mobile applications by the company Bosch Sensortec. It serves to measure humidity, air pressure and temperature. The sensor is based on MEMS technology (Micro-Electro-Mechanical Systems), which ensures a high precision and long-term stability of the measurements.
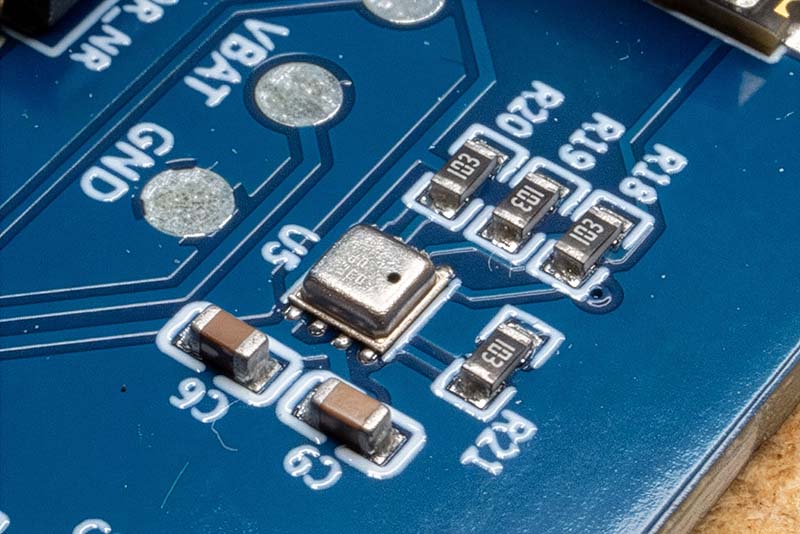
The BME280 can communicate via an I2C or SPI interface, which makes integration into various projects easier. Thanks to its low power consumption it is particularly suitable for battery-powered applications. One disadvantage of the BME280 is that it heats up a little in continuous operation, which can falsify the temperature value. But since on the radio modules it only delivers a value every 10 minutes, this plays no role for the weather station.
The following block diagram shows the structure of the sensor:
Some important key data of the BME280:
- Accuracy:
- Temperature ±0.5 °C in the range 0…65 °C
- Humidity ±3 % RH in the range 20…80 % RH and 25 °C
- Air pressure ±1.0 hPa in the range 300…1100 hPa and 0…65 °C
- Supply voltage: 1.71 V to 3.6 V
- Power consumption:
- 1.8 µA @ 1 Hz humidity and temperature
- 2.8 µA @ 1 Hz air pressure and temperature
- 3.6 µA @ 1 Hz humidity, air pressure and temperature
- 0.1 µA in sleep mode
- Measurement range:
- -40 °C to +85 °C
- 0 to 100 % relative humidity
- 300 to 1100 hPa
RadiationD Geiger counter
I already introduced the RadiationD-v1.1 board in an earlier article. It is anything but a precision sensor, but since I do have the board, I wanted to integrate it into the weather station as well. The built-in Geiger-Müller tube mainly detects gamma radiation and high-energy beta radiation. The conversion factor from counts per time to µSv/h for the J321 tube used (a replica of the M4011 tube) is 0.0066 µSv/h per CPM, i.e. 151 counts per minute correspond to approximately 1 µSv/h.
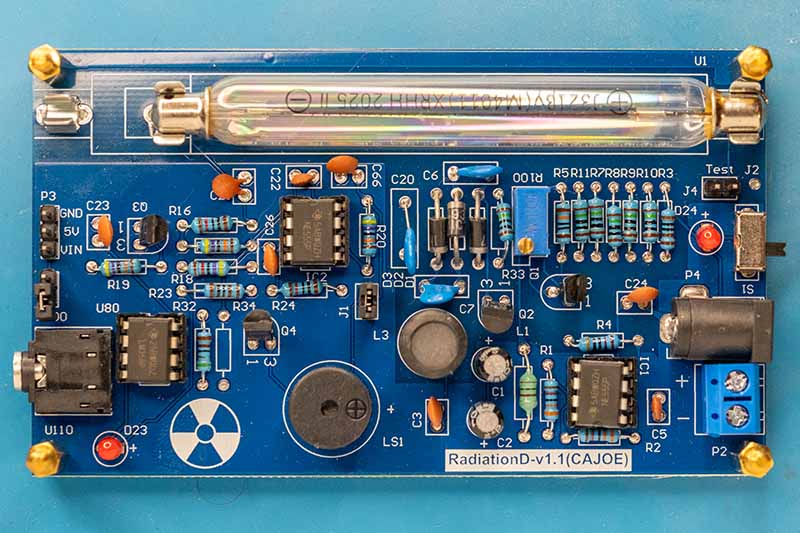
The RadiationD board actually needs a supply voltage of 5 V. On the microcontroller boards, however, only 3.3 V are available. I tried it anyway and, to my surprise, the board works with the 3.3 V as well. I only had to increase the high voltage a little with the trimmer potentiometer.
Sensors for display control
The brightness of the display should adapt automatically to the brightness of the surroundings. This saves a little power on the one hand, and on the other hand it is very unpleasant to look into a display that is too bright when your eyes have already adjusted to the dark. Conversely it is of course also not optimal to read the values on a display that is too dark on a bright day. But there is yet another problem. The illumination of the display generates heat, which can influence the values of the SEN66 sensor. Sensirion has also integrated several mechanisms into the sensor in order to compensate for these factors, but determining these values is not so easy. I therefore only use a simple correction factor that refers to one specific brightness, namely when the display is almost completely dark. Anyone who wants to know this in exact detail can read up in the SEN6x Temperature acceleration and compensation instructions from Sensirion.
BH1750 light sensor
The BH1750 is a digital ambient light sensor that is ideal for controlling the backlight. It has an I2C interface, a large detection range (1 – 65535 lux) and a sufficiently high resolution. Above all, however, this little board is widely available and costs only a few euros.
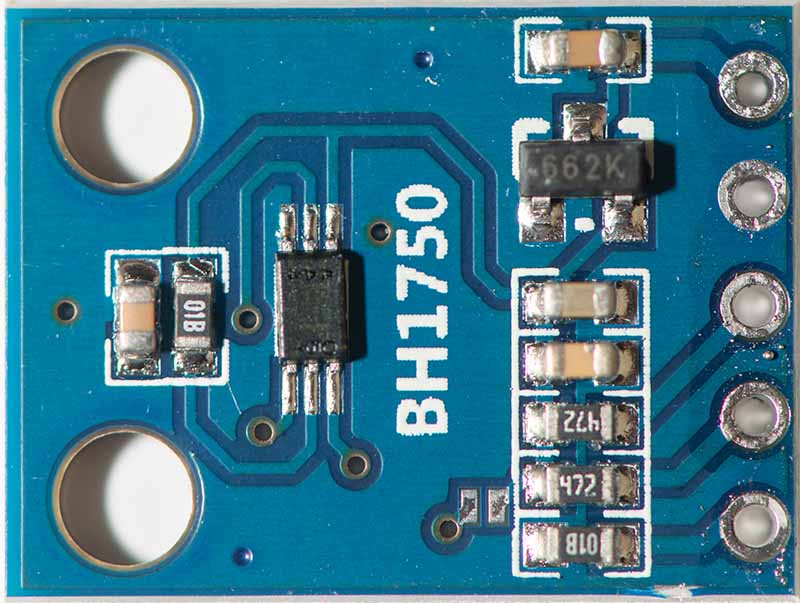
However, the display would then glow quite brightly the whole time on a bright day, and the values of the SEN66 would be significantly too high.
C4001 24GHz mmWave radar sensor
With the C4001 radar sensor from DFRobot you can determine whether someone is in front of the sensor and at what distance. This makes it possible for the display to only assume normal brightness once someone is standing, for example, less than three meters in front of the display. This sensor, too, has an I2C interface.
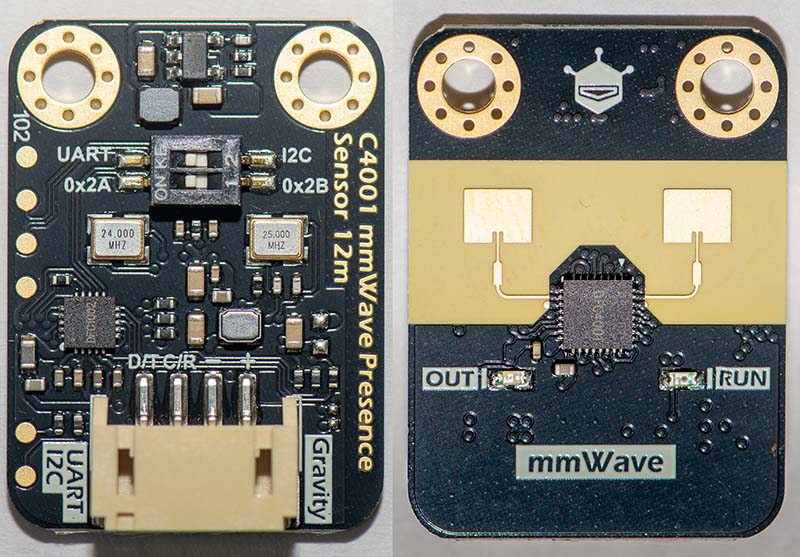
As a result it is now possible to implement a true screensaver functionality, and the problem with the heating is also solved, since the display is almost off most of the time and the short active moments are negligible for the heating.
To determine the correction factor for the SEN66, I placed two SHT45 sensors next to the weather station and let the device work for several hours with a dimmed display. The difference between the weather station and the SHT45 was then 1.4 °C, which arises above all from the waste heat of the ESP32-P4 and of the ESP32-S3 in the receiver.
Integrating a new sensor type
Every sensor firmware, the receiver and the base station share the same packet_format.h structure. For this, each project has a copy in the local common/ folder, but the content must be identical. The format is divided into three layers:
typedef struct __attribute__((packed)) {
    uint8_t msg_type;     // PAIRING_REQ / PAIRING_RESP / DATA
    uint8_t sensor_nr;    // 0-254, identifies the slot (0-5 in the current setup)
    uint8_t sensor_type;  // sensor_type_t
    uint8_t payload_len;  // length of payload[] in bytes (0-64)
} packet_header_t;        // 4 bytes, this is what EVERY sender transmits over the air
The header only says "who am I" and "how many bytes follow". It does not know the concrete meaning of the payload data. The actual measured values are contained in a separate struct per sensor type, e.g.:
typedef struct __attribute__((packed)) {
    uint32_t voltage;      // mV
    float    temperature;  // °C
    float    humidity;     // %RH
} sht45_payload_t;
So that the receiver knows which struct it has to cast onto the raw bytes, there is sensor_type_t:
typedef enum {
    SENSOR_TYPE_BME280  = 1,
    SENSOR_TYPE_SHT45   = 2,
    SENSOR_TYPE_GEIGER  = 3,
    SENSOR_TYPE_CUSTOM  = 255
} sensor_type_t;
The path of a packet looks as follows:
- The sensor board measures, assembles packet_header_t + payload and sends the data via LoRa or ESP-NOW.
- DThe receiver (ESP32-S3) receives the data, internally appends link_metadata_t (RSSI, SNR, timestamp) and places the complete packet into a stack with one slot per sensor_nr.
- The base station (ESP32-P4) polls the receiver every 2 seconds via I2C and gets the raw bytes back.
The receiver is not interested in sensor_type but passes the bytes through unchanged. The interpretation is done exclusively on the base station. This means that a new sensor type requires no change to the receiver project.
On the base station the interpretation runs in gui_sensors.c. For each of the 6 sensor slots there is an entry that links the sensor type, display widget and the associated LVGL label fields:
static const sensor_slot_t sensor_slots[SENSOR_SLOT_COUNT] = {
    { SENSOR_TYPE_SHT45,  render_temp_hum, &objects.sensor_0__name, ...,
      &objects.sensor_0__header, { &objects.sensor_0__temp, &objects.sensor_0__humidity, NULL, NULL, NULL } },
    ...
};
render_temp_hum() itself checks via switch (type) whether it is an SHT45 or BME280 and casts accordingly. The same display widget therefore works for multiple hardware sensors with the same "shape" of the measured values (for example temperature & humidity).
Practical example: anemometer (direction + speed)
Since this topic is especially important for your own extensions, I would like to illustrate the principle using the example of an anemometer that provides wind speed and direction.
1. Extend packet_format.h (in every copy: BaseStation, sensor receiver, and the new sensor project itself):
typedef enum {
    SENSOR_TYPE_BME280  = 1,
    SENSOR_TYPE_SHT45   = 2,
    SENSOR_TYPE_GEIGER  = 3,
    SENSOR_TYPE_WIND    = 4,   // new
    SENSOR_TYPE_CUSTOM  = 255
} sensor_type_t;
typedef struct __attribute__((packed)) {
    uint32_t voltage;         // mV
    float    wind_speed;      // km/h
    float    wind_direction;  // degrees, 0-359 (0 = north)
} wind_payload_t;             // 12 Byte
2. The sender firmware structure is analogous to the existing LoRa SHT45 sensor (Sensor-LORA-SHT45/main/main.c): board wakes up, measures, builds packet, sends via LoRa, goes back to sleep. Only the measurement and payload part changes:
float speed_kmh, direction_deg;
wind_sensor_read(&speed_kmh, &direction_deg);   // own driver

lora_sensor_packet_t packet;
memset(&packet, 0, sizeof(packet));
packet.header.msg_type    = DATA;
packet.header.sensor_nr   = cfg.sensor_nr;      // slot, set in the config menu on the device
packet.header.sensor_type = SENSOR_TYPE_WIND;

wind_payload_t wind_payload = {
    .voltage        = voltage,
    .wind_speed     = speed_kmh,
    .wind_direction = direction_deg,
};
memcpy(packet.payload, &wind_payload, sizeof(wind_payload_t));
packet.header.payload_len = sizeof(wind_payload_t);

sx1262_send((uint8_t *)&packet, sizeof(packet_header_t) + packet.header.payload_len);
3. In the receiver project there is no change. It doesn't know SENSOR_TYPE_WIND at all and doesn't need to know it either, it only transports bytes.
4. In the base station in gui_sensors.c: a new render function is implemented that knows what a wind_payload_t looks like:
static void render_wind(sensor_type_t type, const sensor_values_t *v, const void *payload)
{
  if (type != SENSOR_TYPE_WIND) return;
  const wind_payload_t *d = (const wind_payload_t *)payload;

  char buf[16];
  sprintf(buf, "%.1f", d->wind_speed);
  lv_label_set_text(*v->value1, buf);

  // Rotate compass needle - same principle as the wind icon in the weather widget
  // (see gui_weather.c: lv_img_set_angle(objects.current__wind_direction, ...))
  lv_image_set_rotation(*v->value2, (int32_t)(d->wind_direction * 10));
}
And the slot table entry, e.g. if sensor 3 is to be the anemometer in the future:
// Anemometer
{ SENSOR_TYPE_WIND, render_wind, &objects.sensor_3__name, &objects.sensor_3__icon,
  &objects.sensor_3__battery, &objects.sensor_3__wifi, &objects.sensor_3__header,
  { &objects.sensor_3__speed, &objects.sensor_3__direction_icon, NULL, NULL, NULL } },
5. Finally, a new Sensor_Wind user widget for slot 3 has to be created in EEZ Studio (with the appropriately named fields for speed and direction display). This is the step I described further above on the topic of the static struct. The widget type per slot is already defined in the layout. How the data is displayed is entirely up to your own creativity. It can simply be two numbers, or a rotating icon, or also a history of the last 24 hours like with the Geiger counter.
The weather APIs used
The weather station displays forecasts for the next 48 hours and the coming 8 days. So that I am not dependent on a single provider, the software now supports three different weather APIs, between which you can switch in the setup via a dropdown.
Open-Meteo
Open-Meteo is not a classic company, but first and foremost an open-source project by Patrick Zippenfenig. The complete source code is publicly available on GitHub, all data sources used are disclosed, and anyone who wants to can even host the API themselves. The attitude behind it is avowedly that good weather data should be freely available for everyone, and you notice that when getting started as well:
- No registration, no account, no API key
- Over 2 TB of processed data daily from models of national weather services such as DWD, NOAA or ECMWF
- Free for non-commercial use
- Current values, hourly and daily forecast do not come together, but require three separate API calls
VisualCrossing
The company behind VisualCrossing, the Visual Crossing Corporation based in Reston, Virginia, was founded in 2003 by Sean McCafferty and Andrew Wigmore and has specialized in historical weather data, forecasts and climate summaries. The stated ambition is to make weather data more easily and more cheaply accessible than many other providers:
- Free account, API key as a parameter, no credit card needed
- A single call delivers current values, hourly and daily forecast together
- Billing by records, but a complete forecast query counts as one record across the board, no matter how many days or hours are requested
- 1,000 records per day free of charge, which easily suffices for a call every 15 minutes.
OpenWeatherMap
OpenWeatherMap is operated by OpenWeather Ltd., founded in 2012 and based in London. The company combines classic weather models with its own AI and machine-learning methods for data processing and, by its own account, supplies over six million users with more than two billion forecasts daily. For the One Call API in the current version 4.0, which the weather station also uses, the following applies:
- Credit card mandatorily required, even within the free quota
- 1,000 free calls per day, chargeable after that
- Highest registration effort of the three providers, but the most detailed raw data in return
I described the registration process in the article about the old Raspberry weather station, but I cannot guarantee that nothing has changed in the meantime.
Technical peculiarities of the three APIs
Besides the pure registration effort, the three APIs also differ significantly from one another technically.
With Open-Meteo you can specify exactly, for each of the three endpoints, which fields you want to have, which keeps the responses lean, but also requires three separate requests. The weather codes follow the WMO standard, and my icons also adhere to this standard.
VisualCrossing scores with the single call already mentioned for all three time periods. Instead of a numeric weather code, the API delivers a descriptive string such as *partly cloudy day*, which you have to map onto an icon set yourself.
OpenWeatherMap is, in version 4.0, split into three completely separate endpoints, unlike in older versions of the API. Hourly data is capped at 20 entries per response, so that for a 48-hour preview several calls with pagination are needed.
Since all three APIs bring structurally different responses, different units of measurement and different weather code systems, there is a common, neutral target format for weather data in the firmware. Each of the three providers has its own mapping for this, which maps the respective raw data onto this common format. The actual display, i.e. display values and the diagrams for the hourly and daily history, only knows this target format and does not have to know whether the data currently comes from Open-Meteo, VisualCrossing or OpenWeatherMap. The three different weather code systems are also each mapped onto the same set of 28 weather icons in the process.
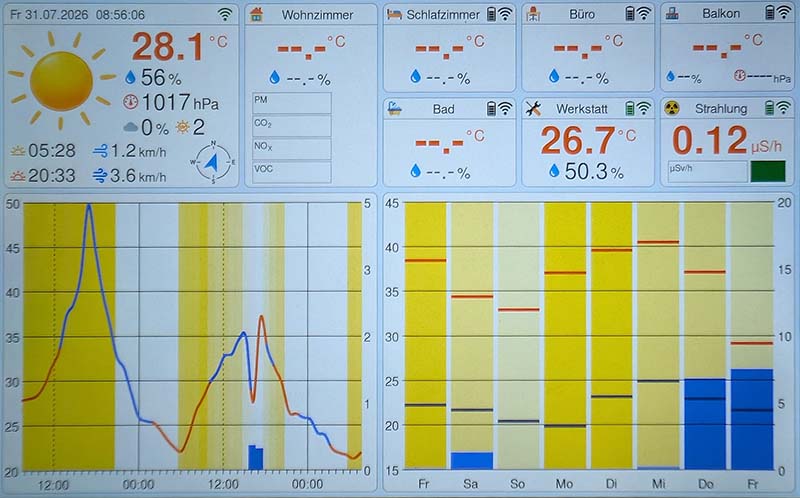
Which API is the most accurate is hard to say. I tested all three APIs for a while and occasionally every API is off. Especially as far as precipitation is concerned, the values are often inaccurate. I was really shocked, however, by this data from OpenWeatherMap. Fortunately it was then, after all, "only" 38 °C.
Hardware of the base station
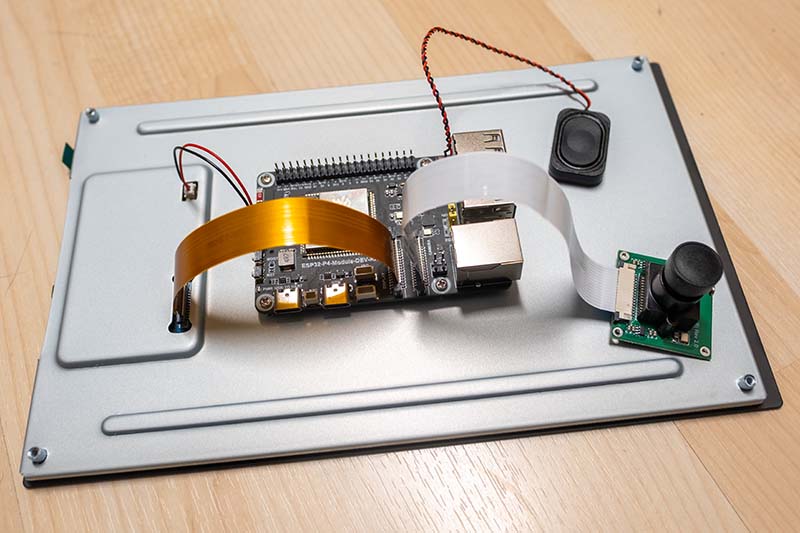
The central component of the weather station is the Waveshare ESP32-P4-Module-DEV-KIT-C. As the display, a 10.1-inch IPS panel with a native resolution of 800 × 1280 pixels, a contrast ratio of 800:1 and a brightness of 400 cd/m² serves. The image data transmission is done via a 2-lane MIPI-DSI interface over a 22-pin FPC cable directly from the microcontroller module. For the capacitive touch detection, the corresponding I2C signal lines (GPIO7 and GPIO8) are integrated directly into the display connection.
The heart of the board is the module developed by Waveshare with the ESP32-P4 SoC. This has a 360 MHz dual-core RISC-V main processor with integrated FPU and DSP instruction set extension, complemented by a low-power core at 40 MHz as well as 32 MB of PSRAM connected internally in the package and 16 MB of external flash memory. Since the ESP32-P4 does not bring its own radio interface, an ESP32-C6-MINI-1 is additionally integrated on the module as a dedicated radio coprocessor, which provides Wi-Fi 6 (802.11ax), Bluetooth 5.4 as well as 802.15.4 (Zigbee/Thread).
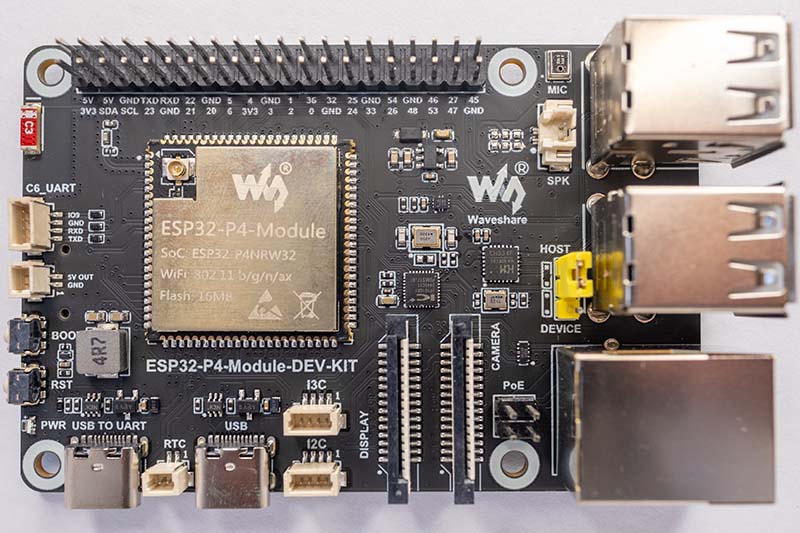
The on-chip communication between the P4 and the C6 is done via an SDIO bus using the ESP-Hosted-MCU firmware. The ESP32-C6 acts as a transparent network adapter and processes the entire radio stack in the background, while on the ESP32-P4 the regular Wi-Fi and Bluetooth drivers of the ESP-IDF can be used for network communication.
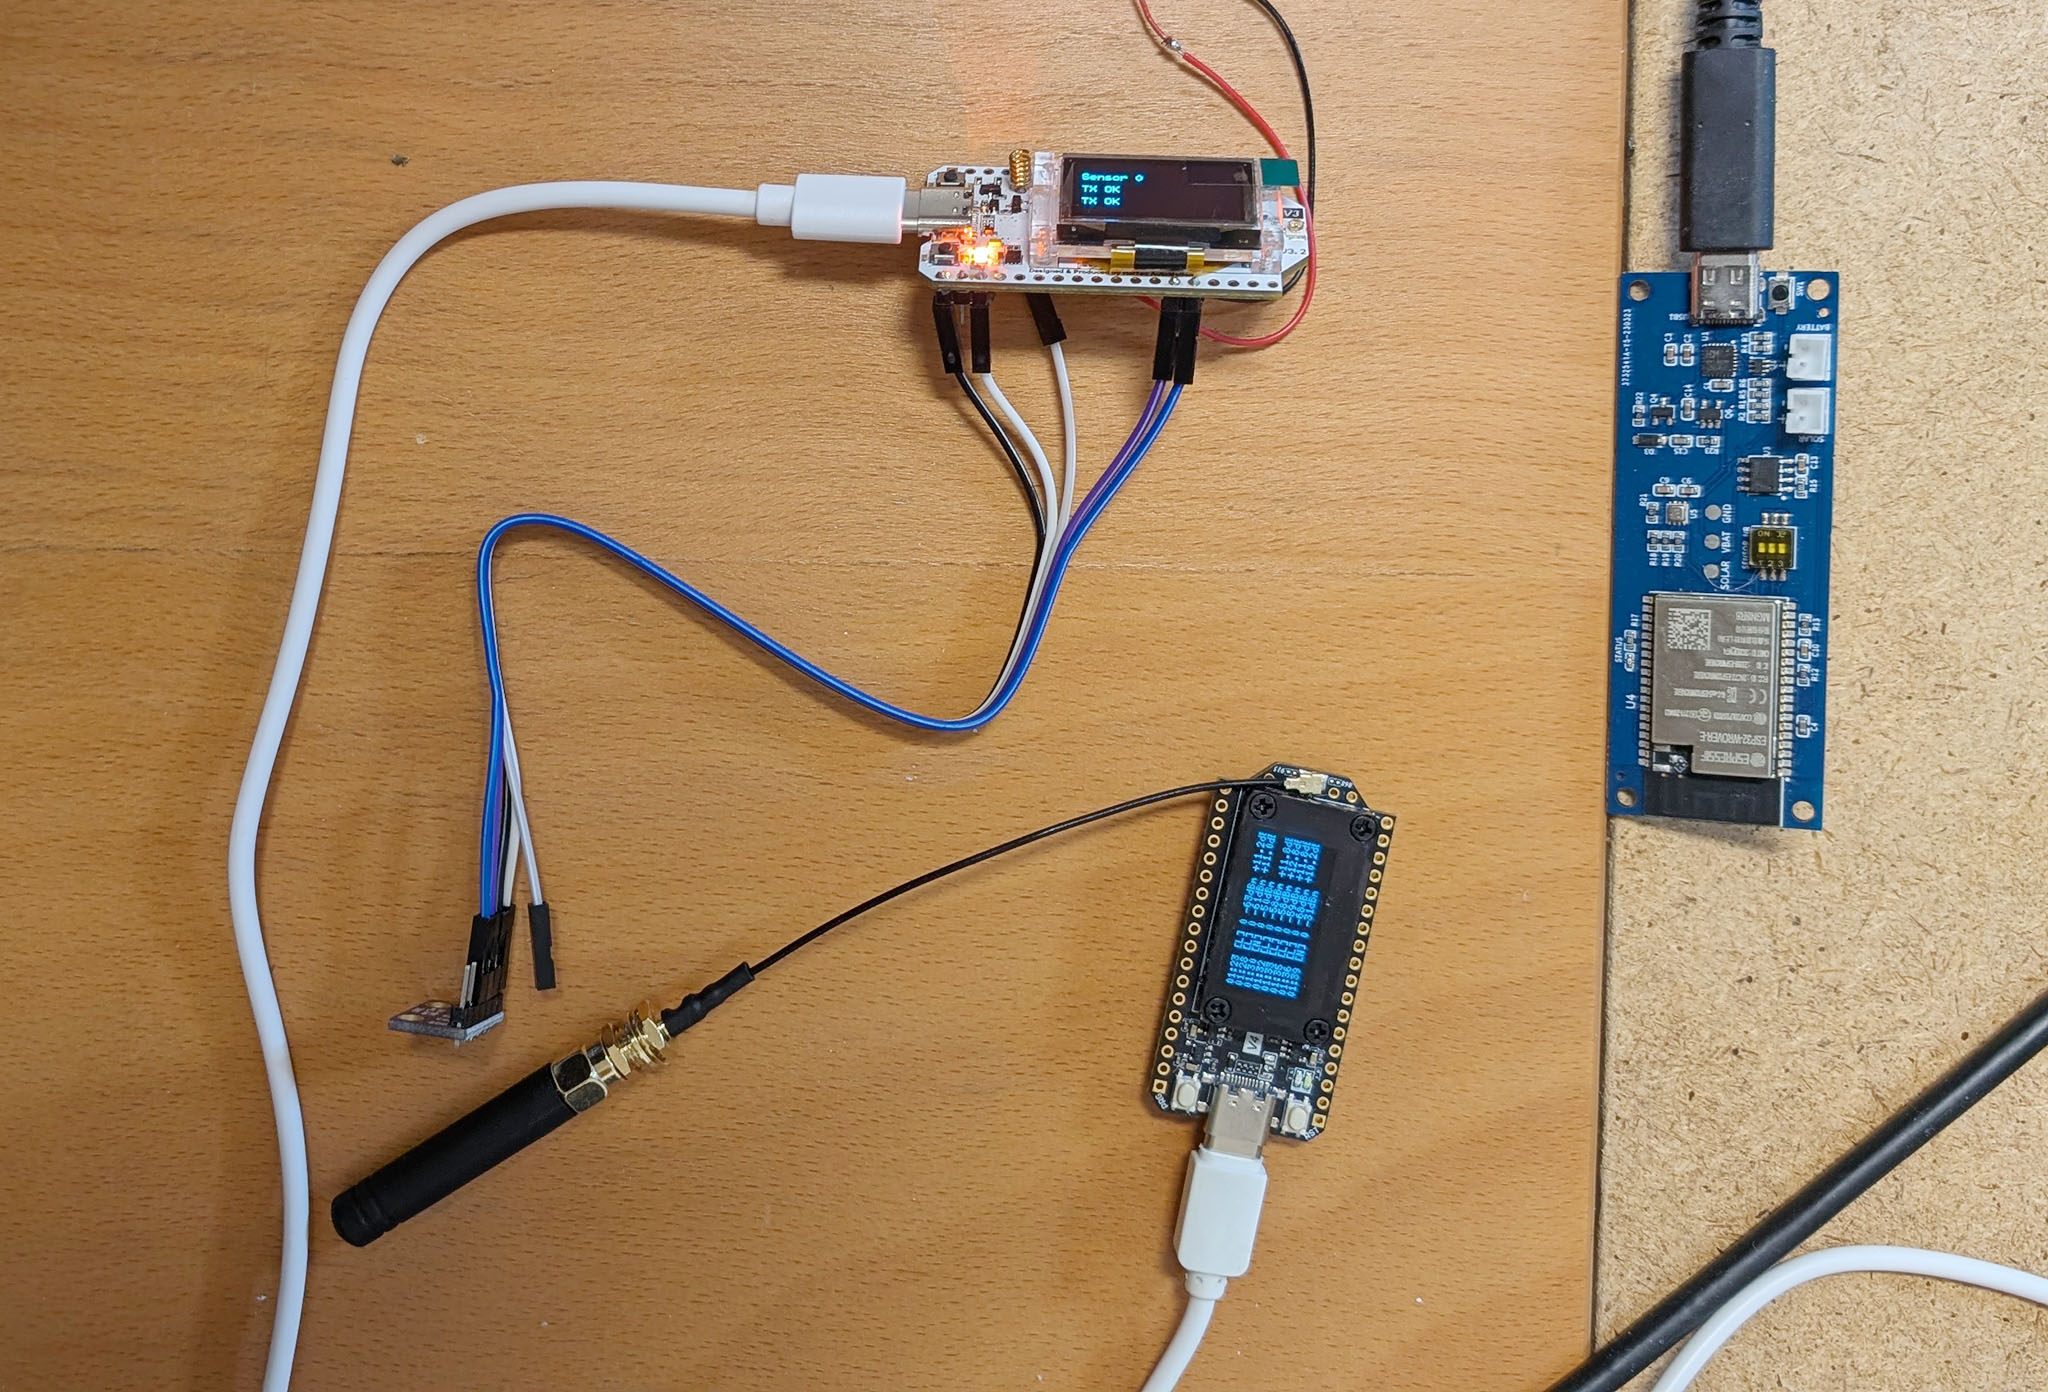
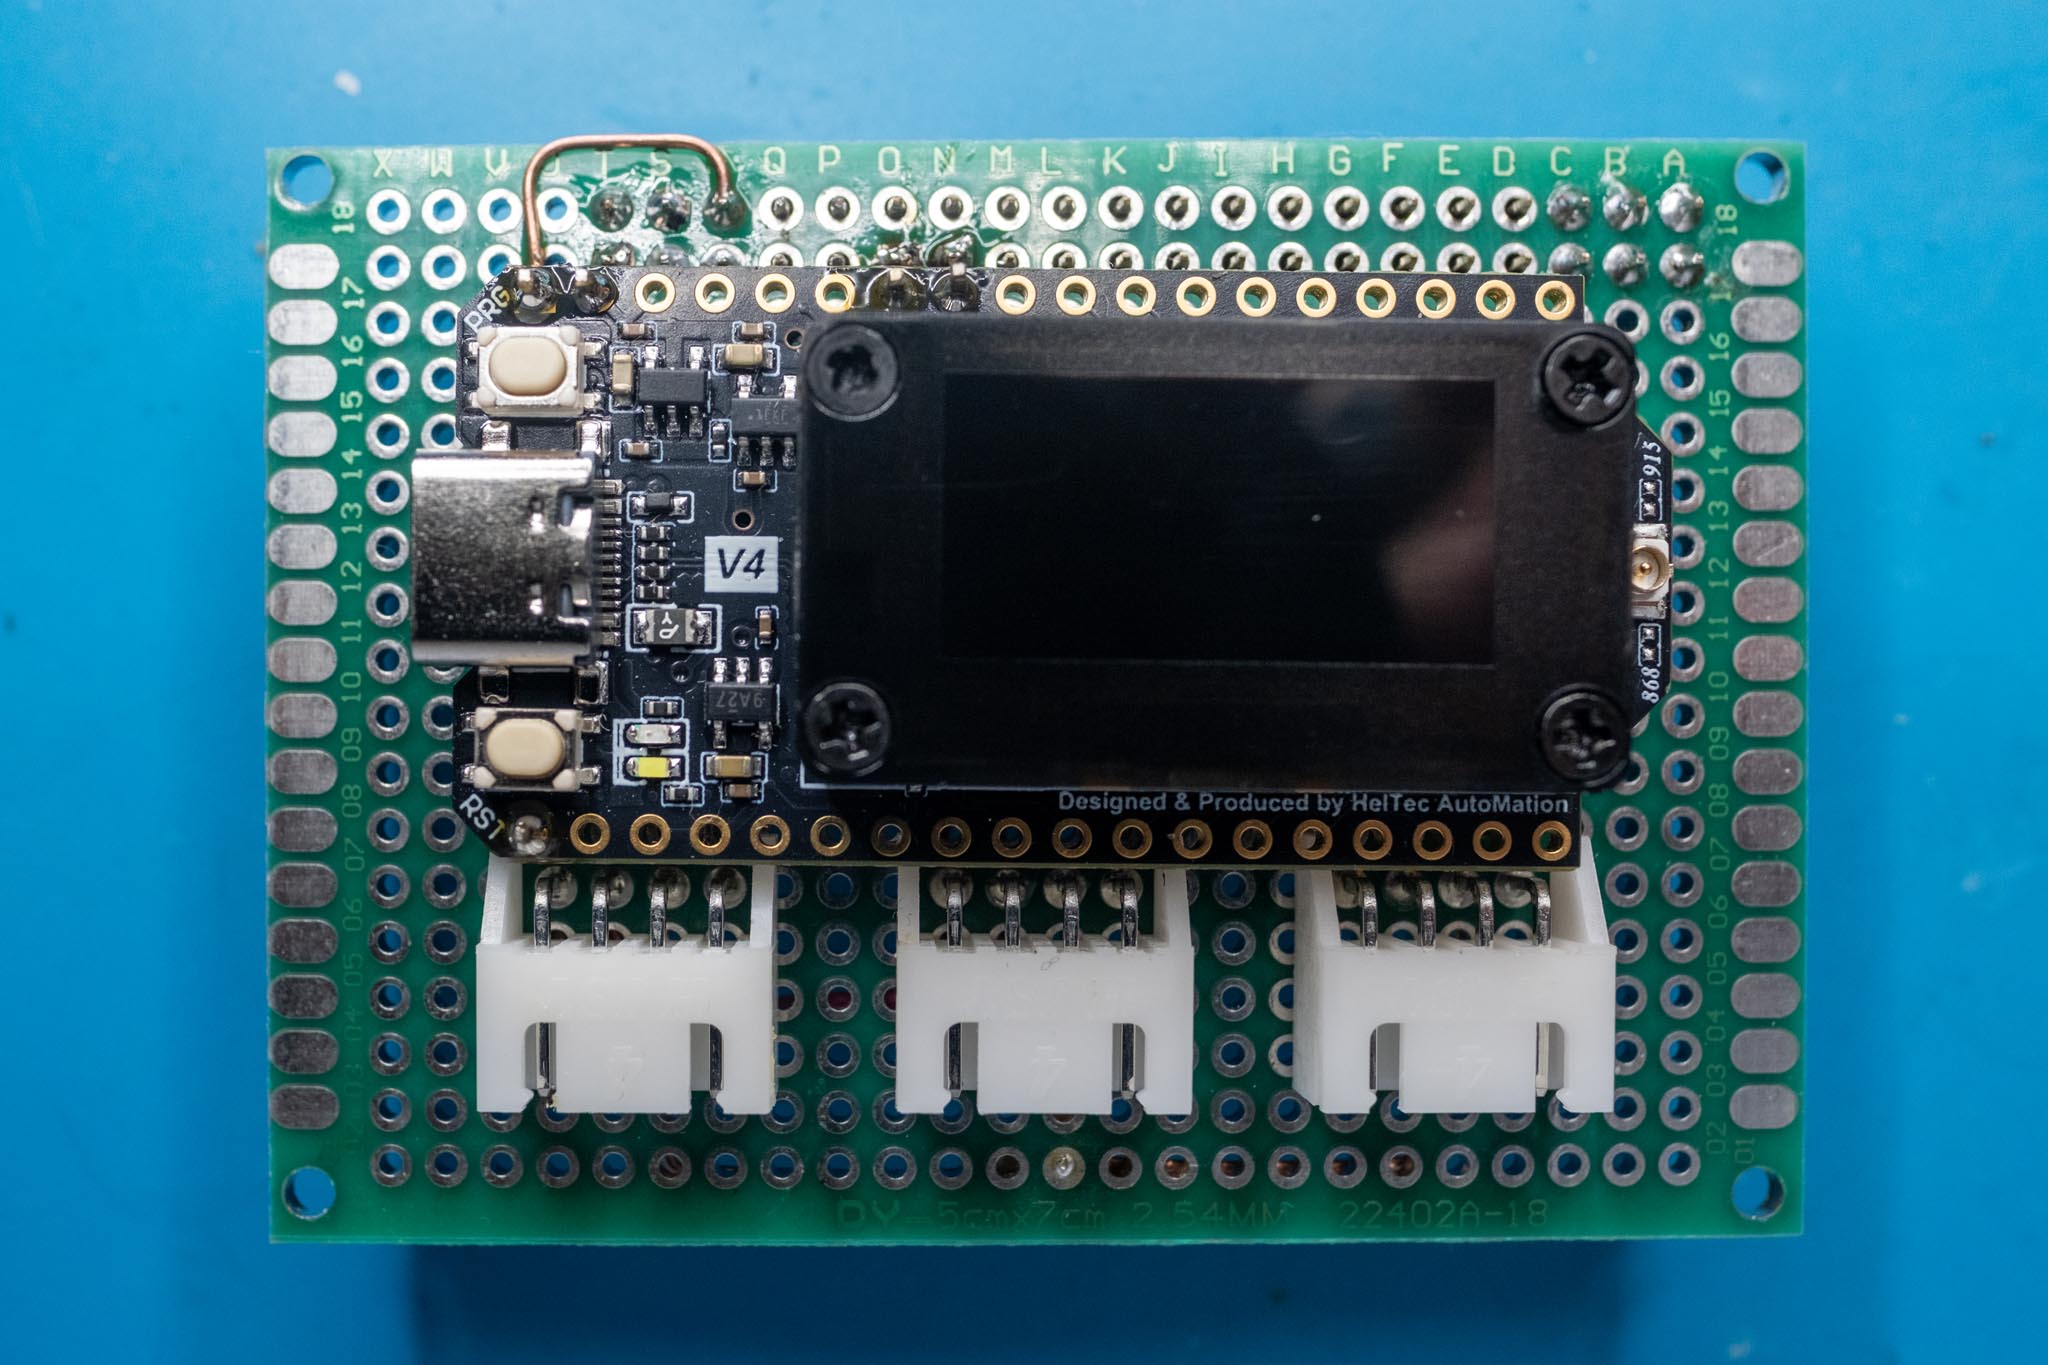
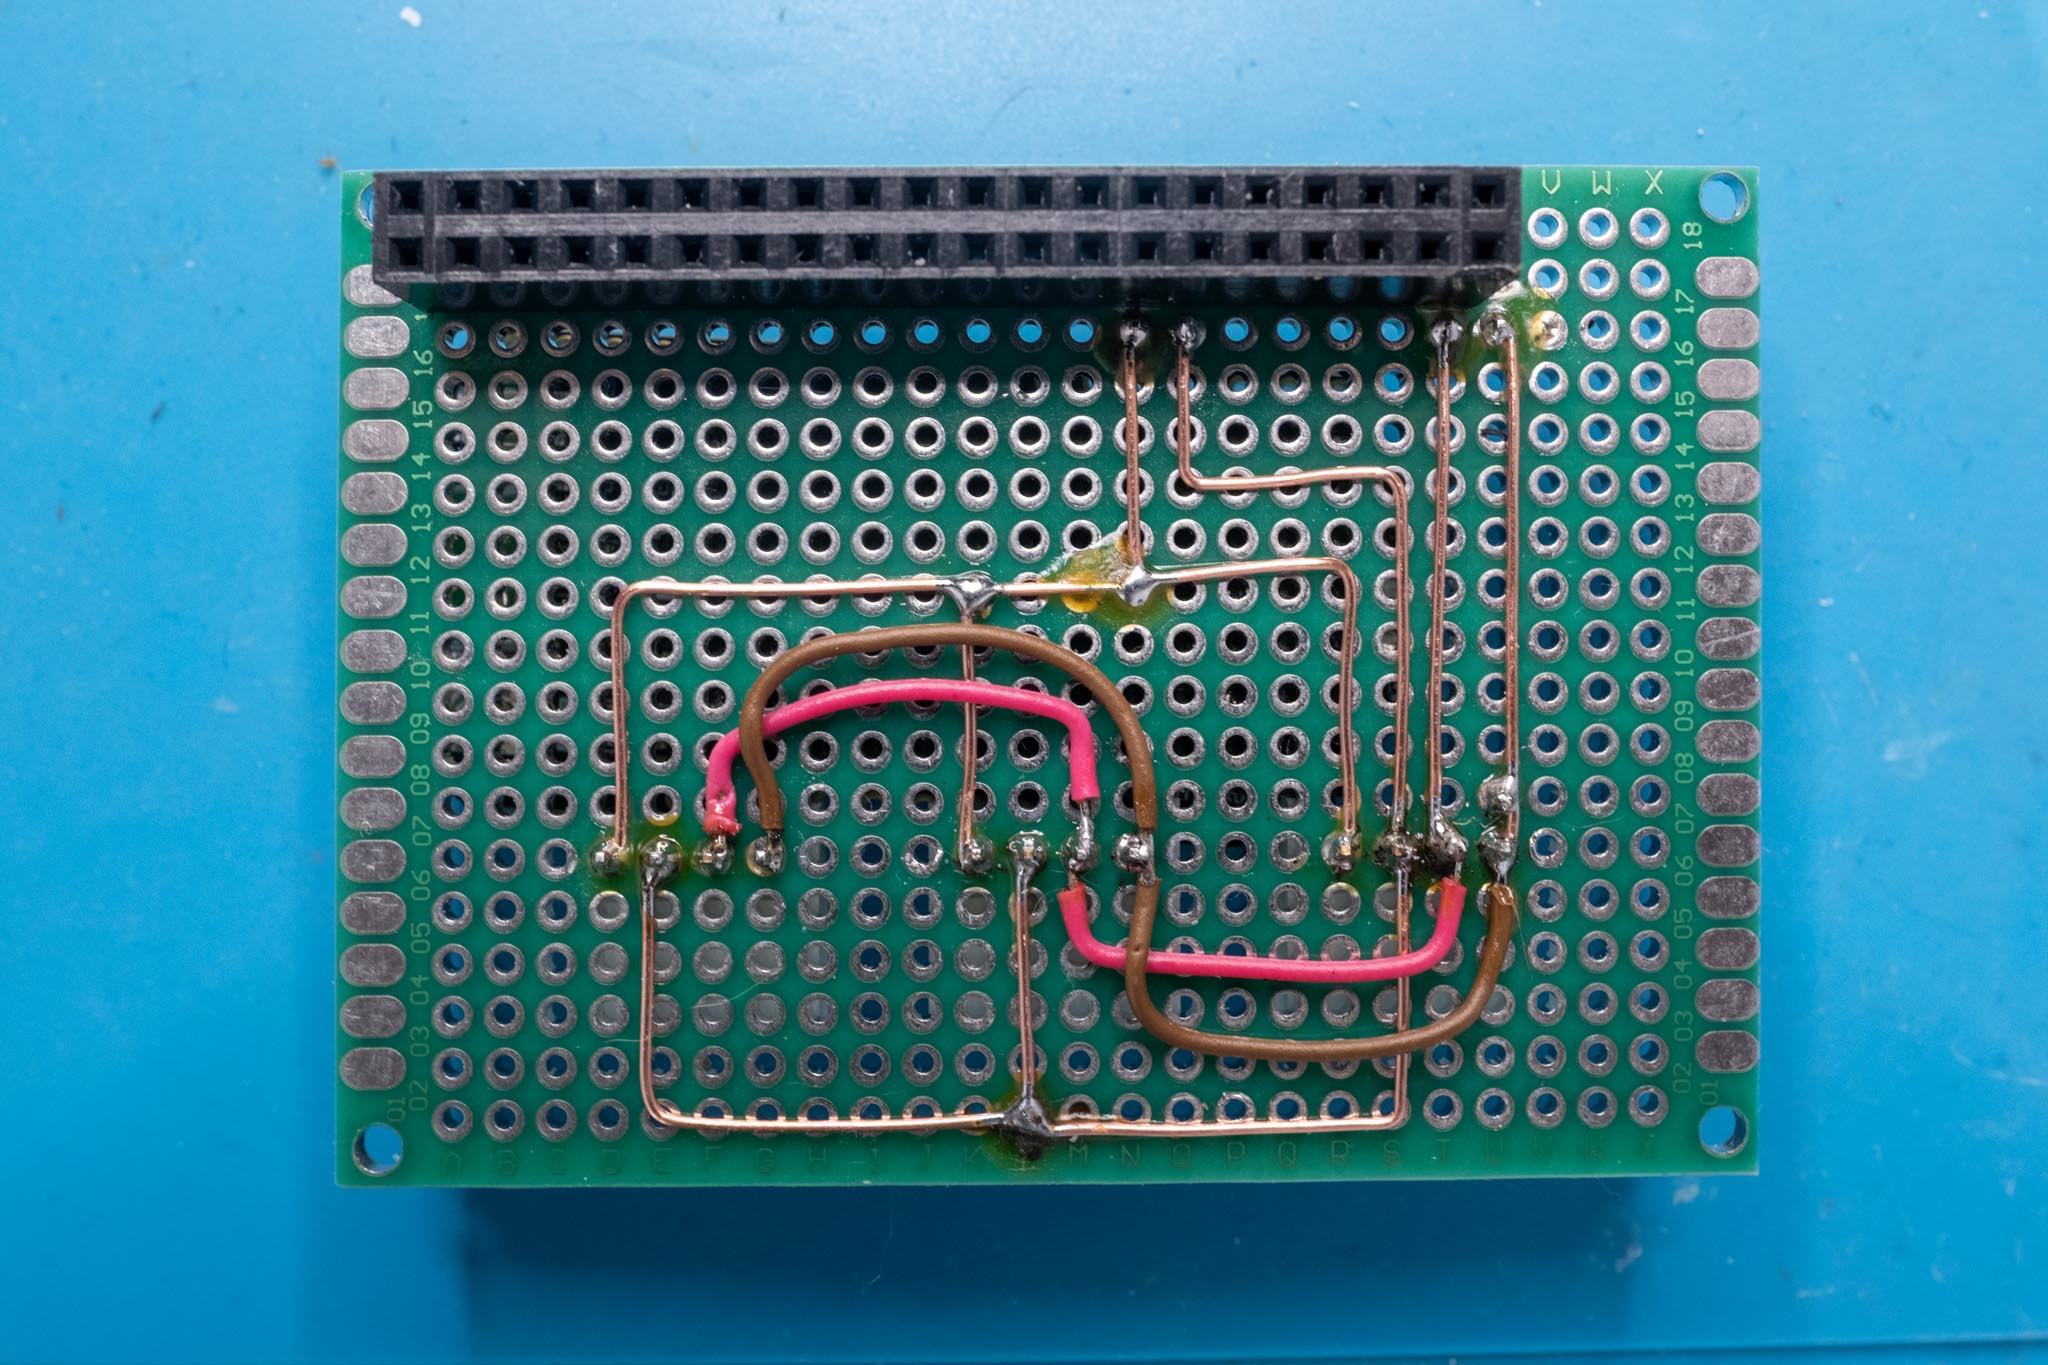
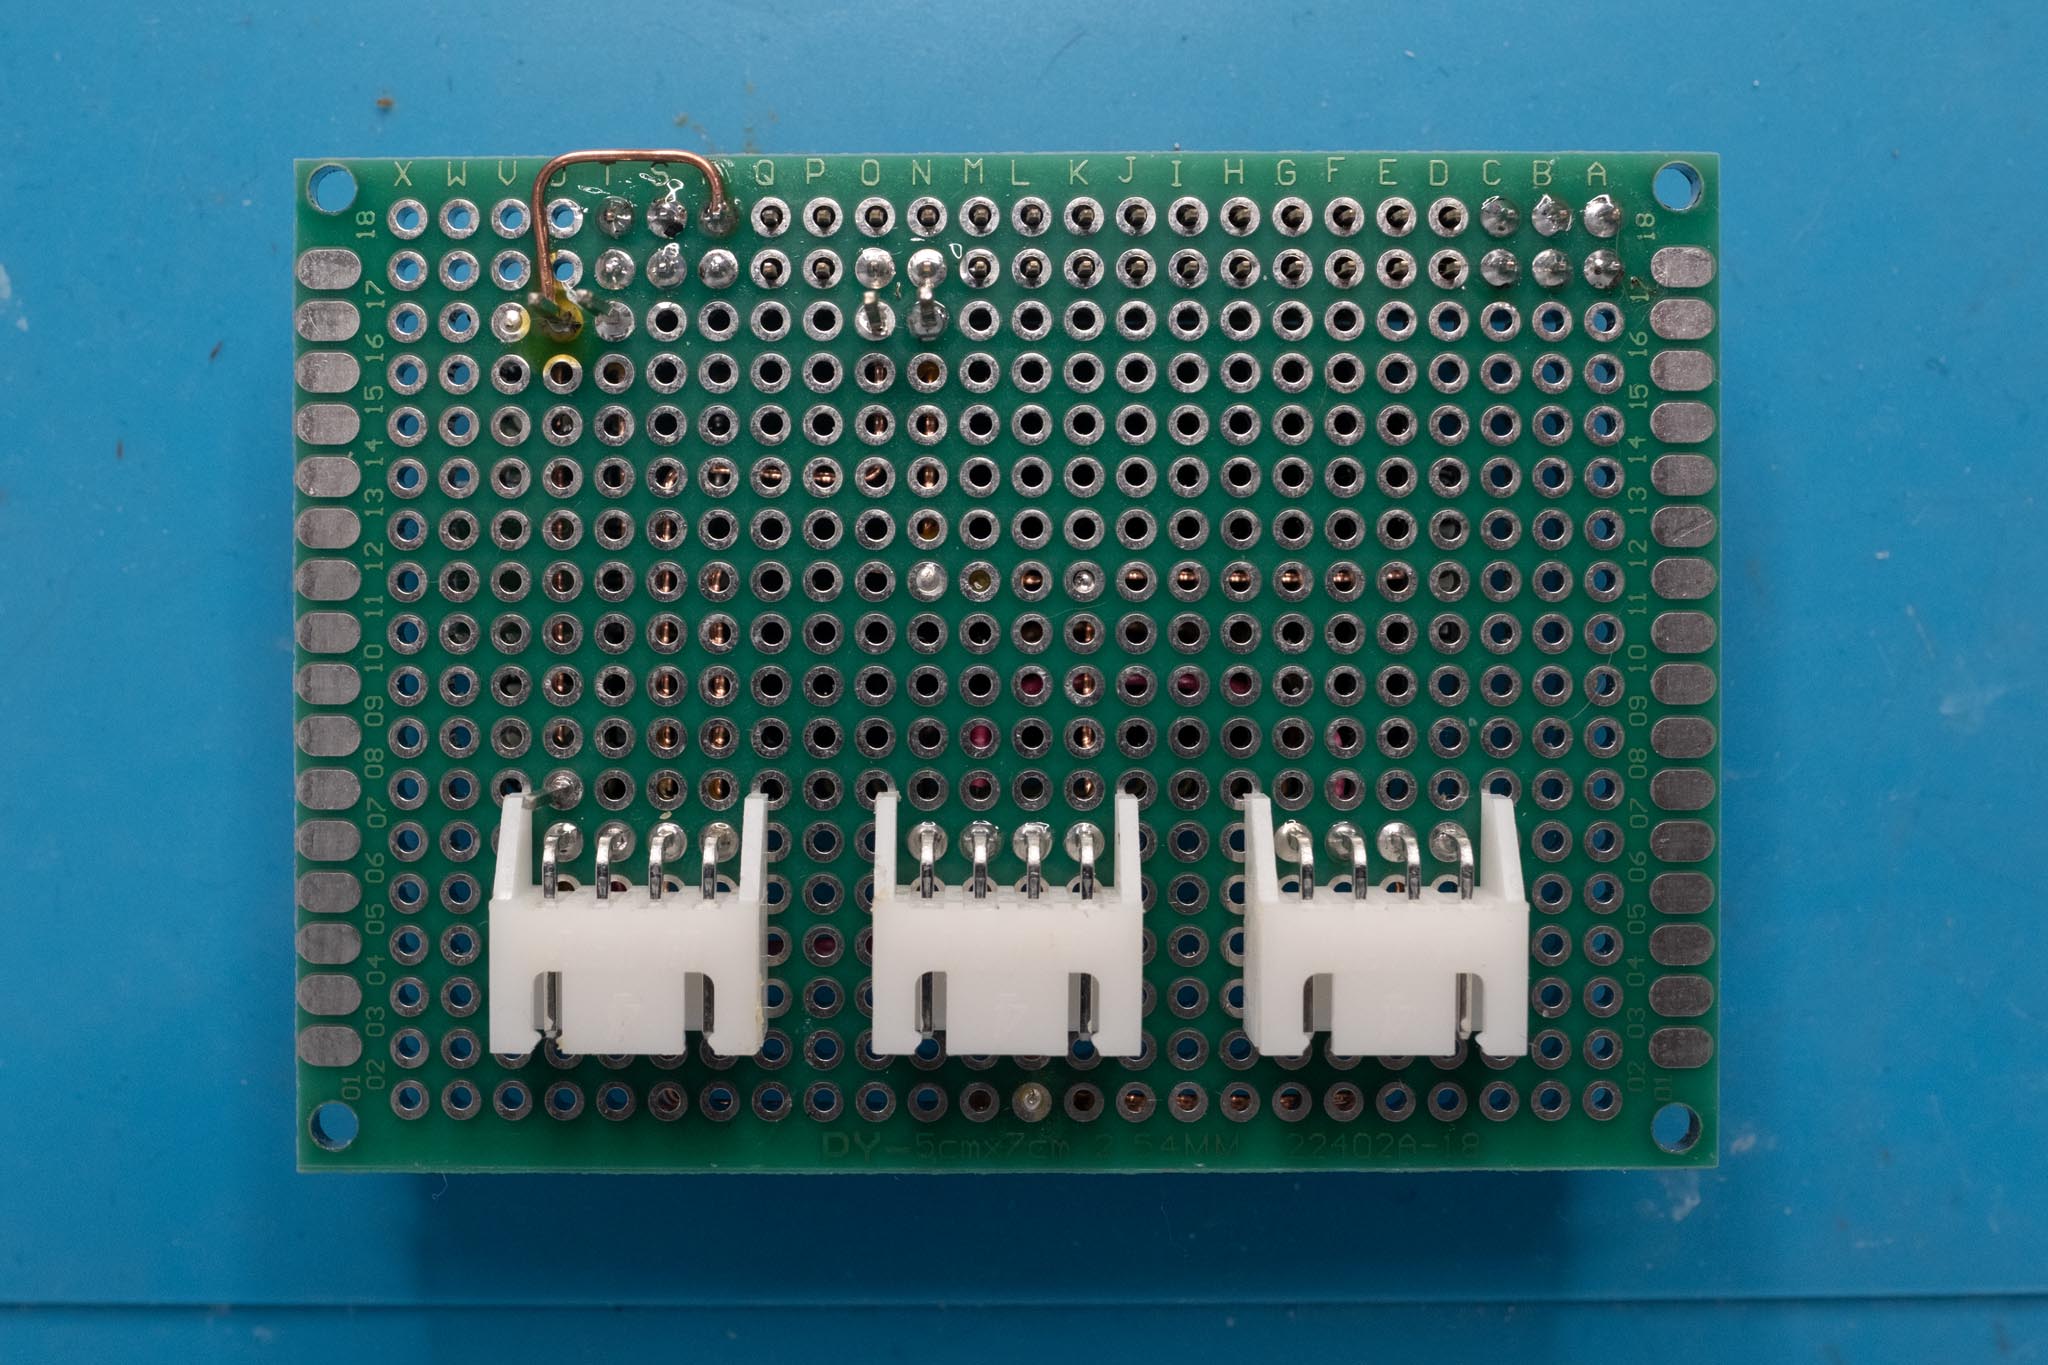
A Heltec WiFi LoRa 32 V4 board takes on the function of the receiver. On the board, an ESP32-S3 and a Semtech SX1262 work, which is why both ESP-NOW and the LoRa radio protocol are supported. On the display the received packets are shown with signal strength. Communication with the ESP32-P4 is done via the same I2C bus that the touch controller also uses. The Heltec board as well as the connectors for the internal sensors are housed on a small add-on board that is plugged onto the ESP32-P4 module via the 40-pin GPIO header. Although the ESP32-P4 module also offers a dedicated I2C connector, which would have sufficed for the pure power supply and the two data lines, the connection via the GPIO header at the same time provides a stable mechanical fastening of the board.
The enclosure and assembly
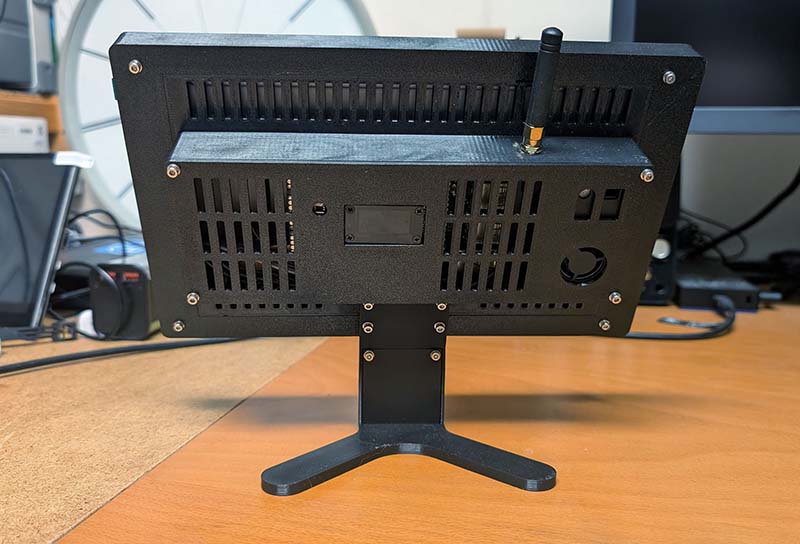
I really struggled with the enclosure. Originally the rear cover was planned as a single part, but I was never satisfied with the result, and in addition a lot of support material was needed during 3D printing. The design of the ESP32-P4 module didn't make the matter any easier either. Due to the Raspberry Pi form factor, the USB connectors sit very far inside, but my goal was to be able to flash new firmware even in the assembled state. In the end I decided on a version made of two parts, which simplified printing considerably.
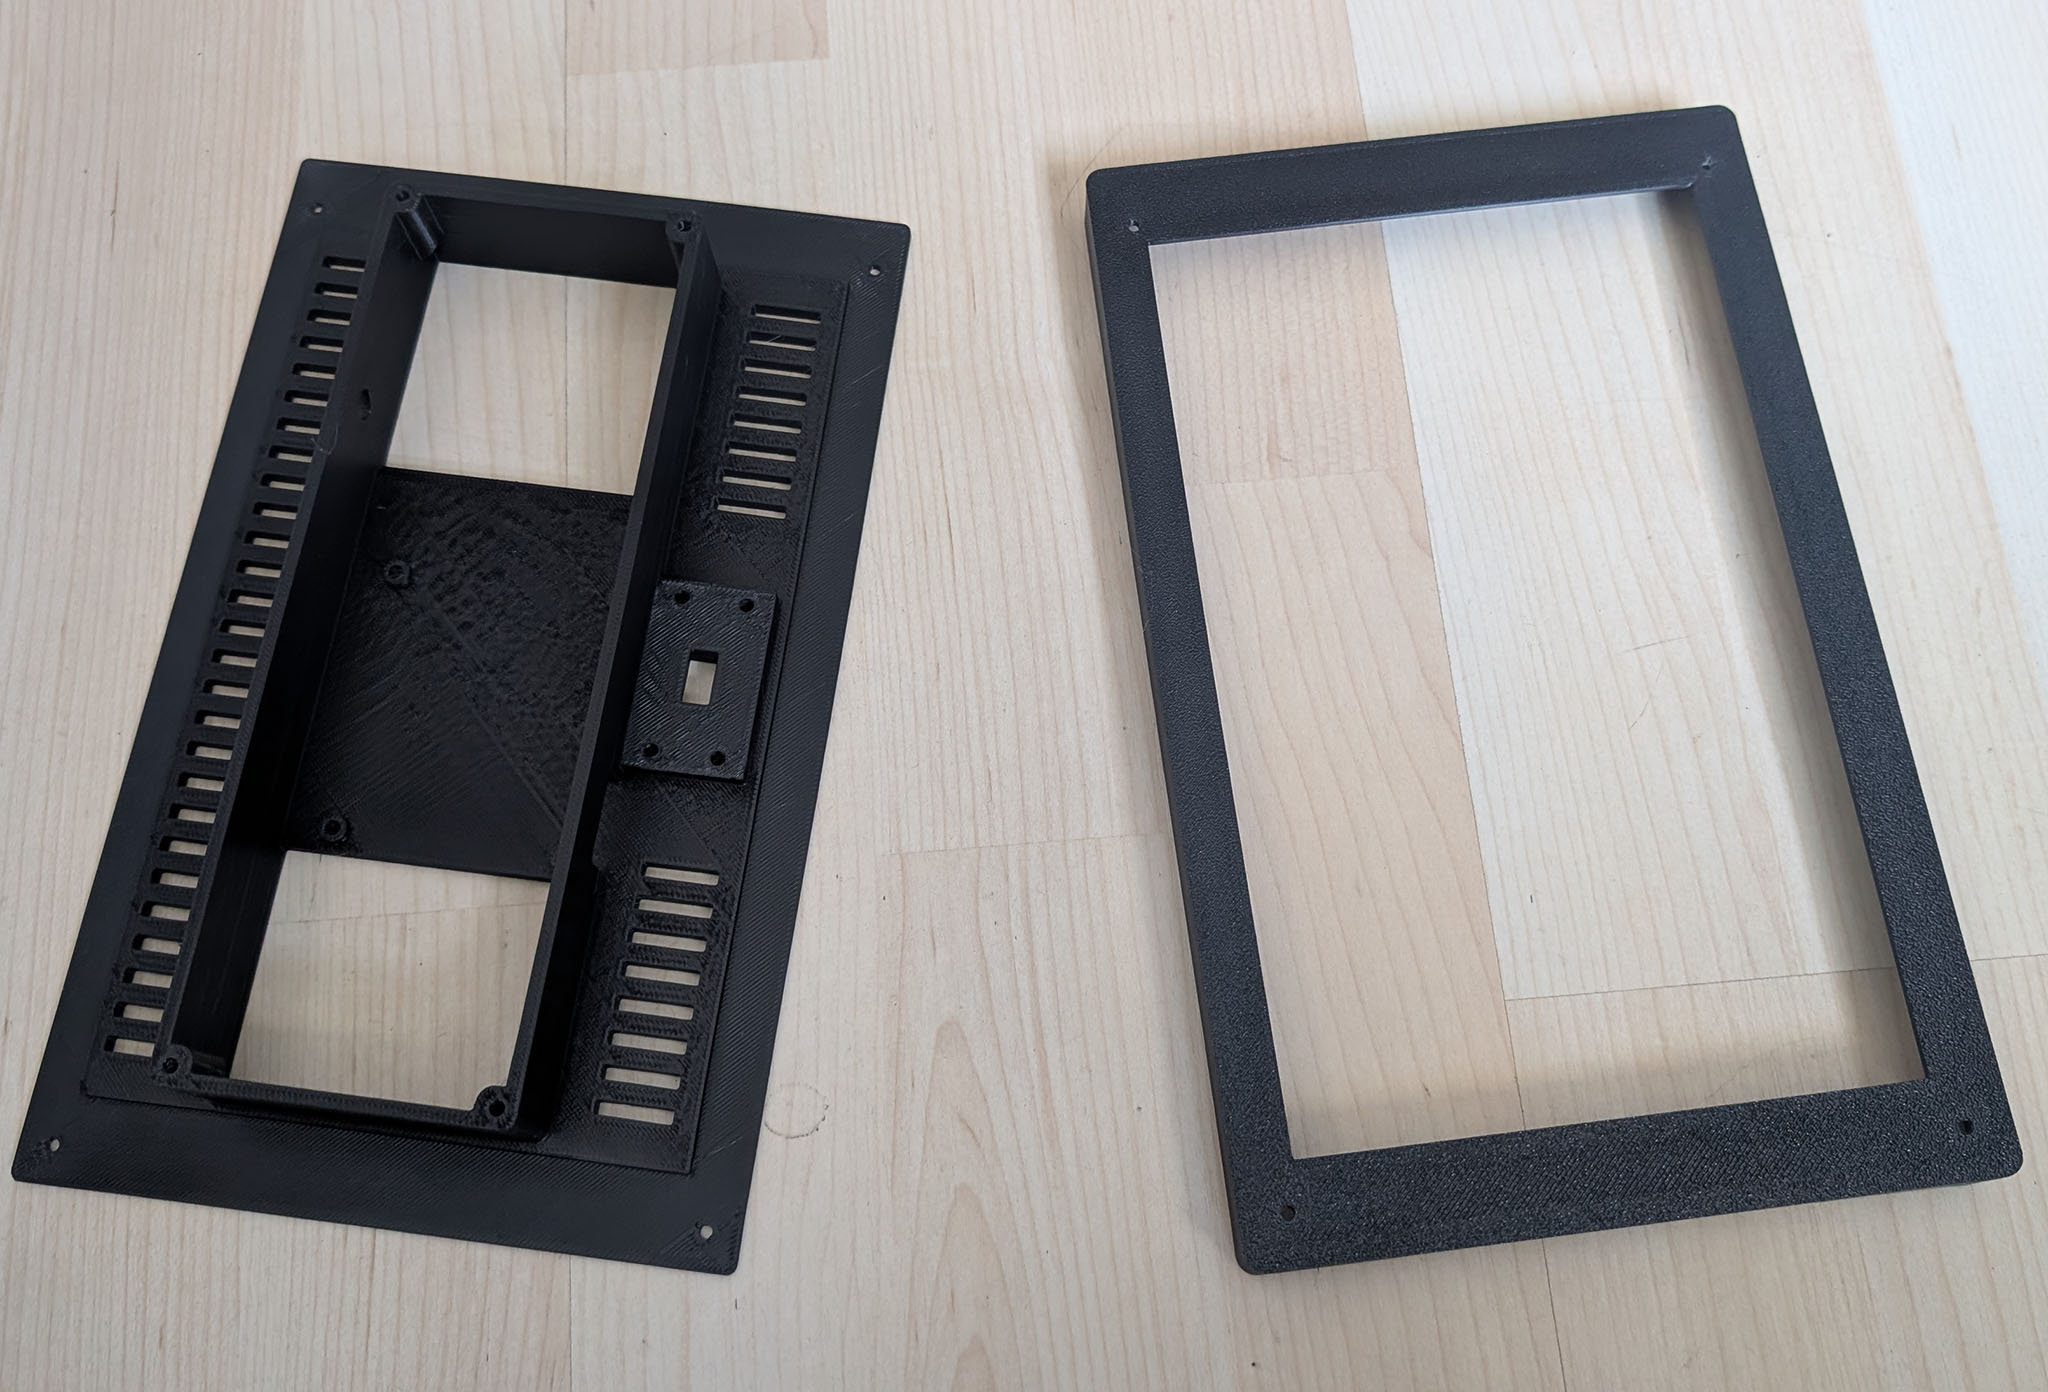
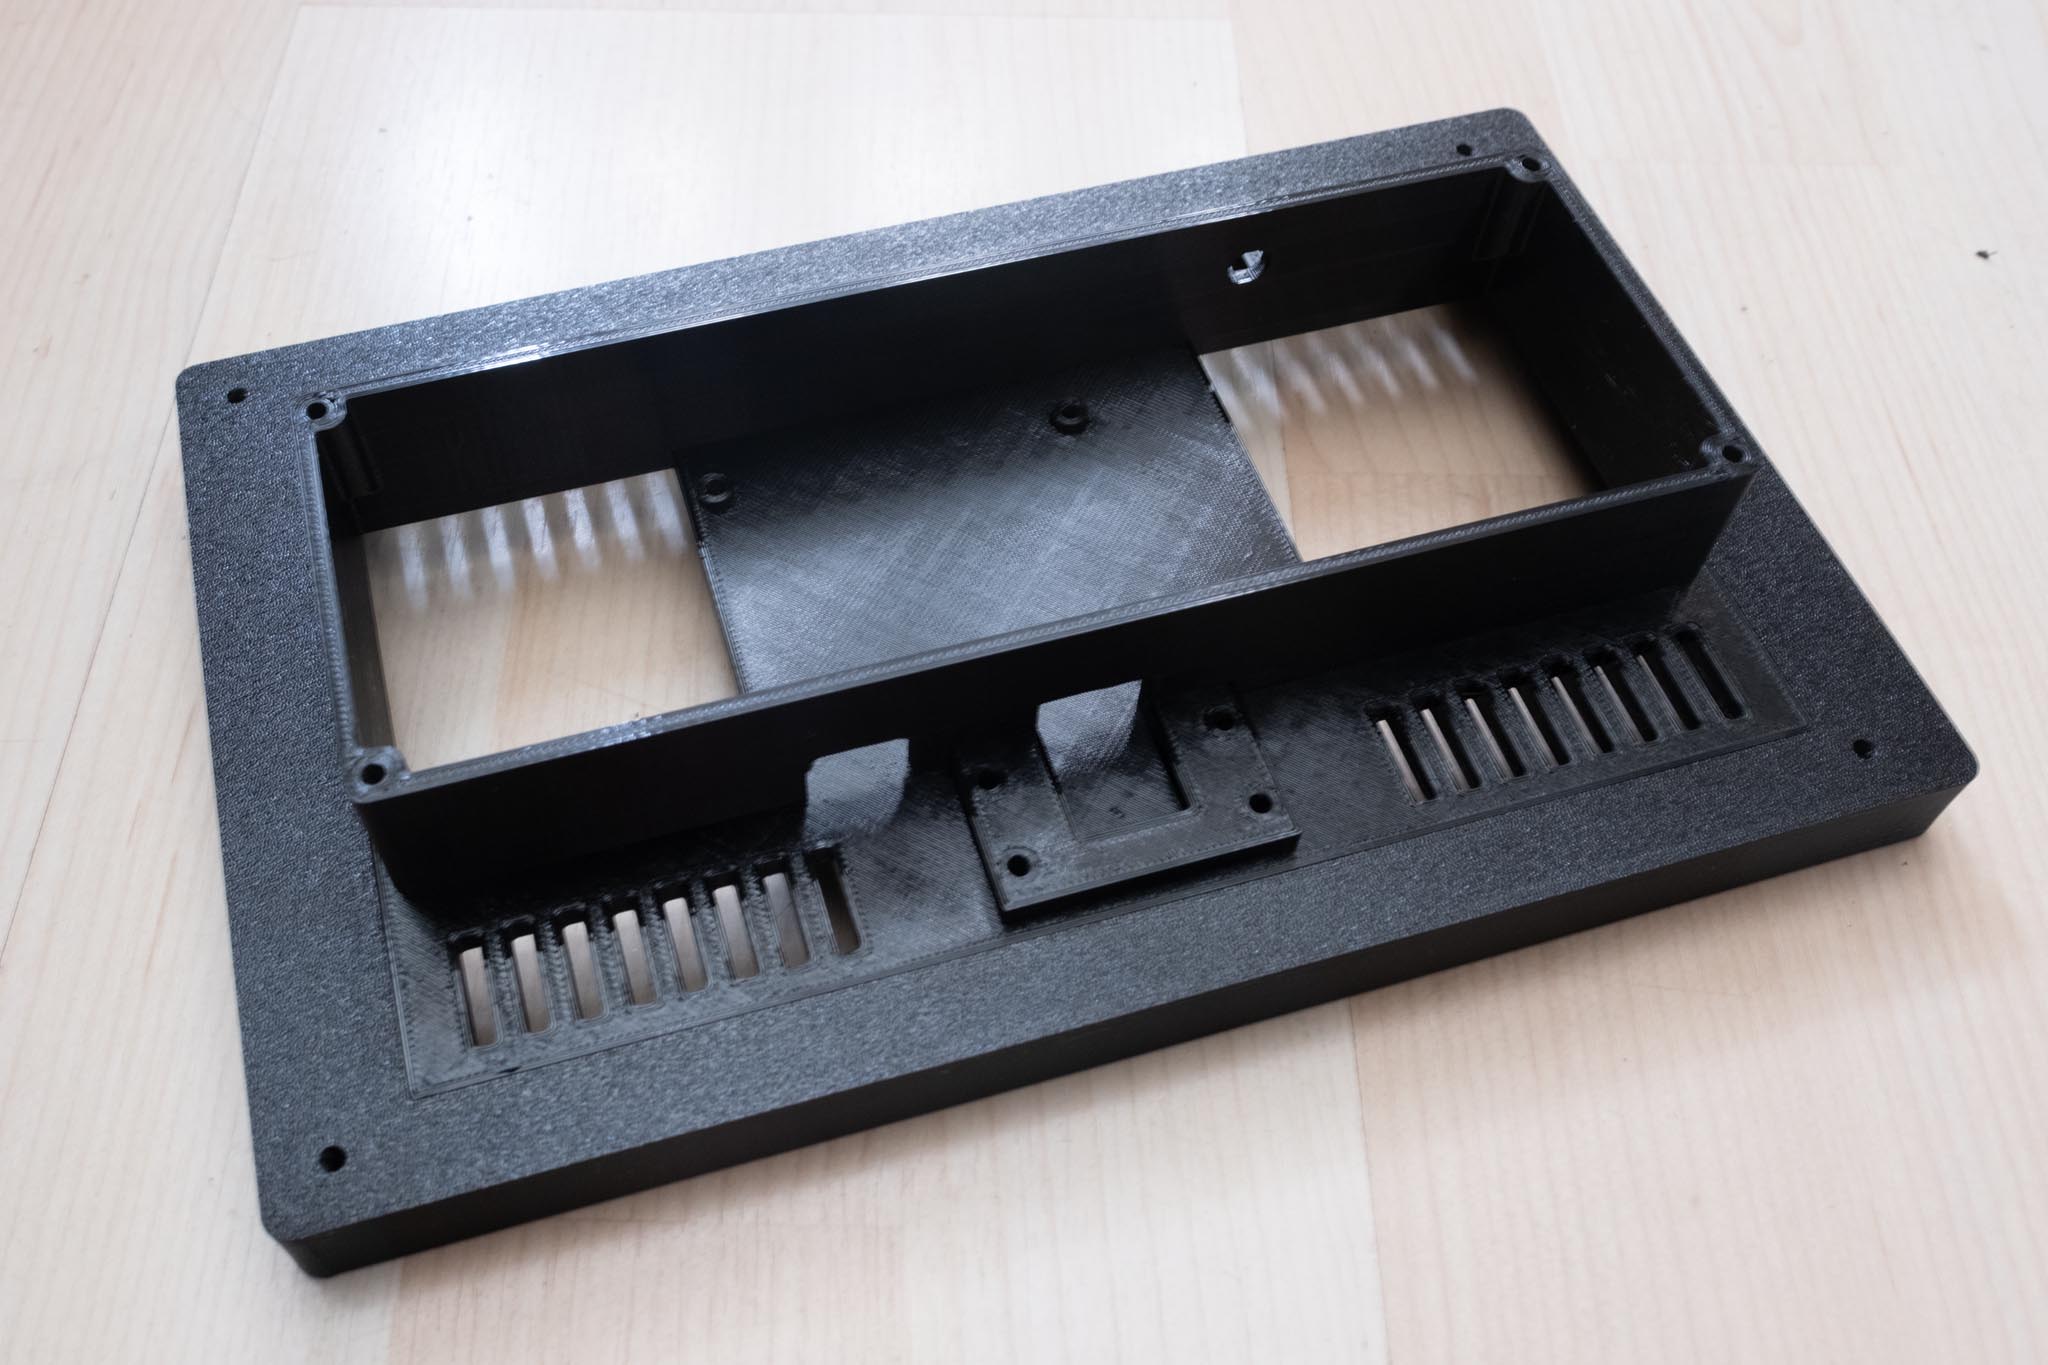
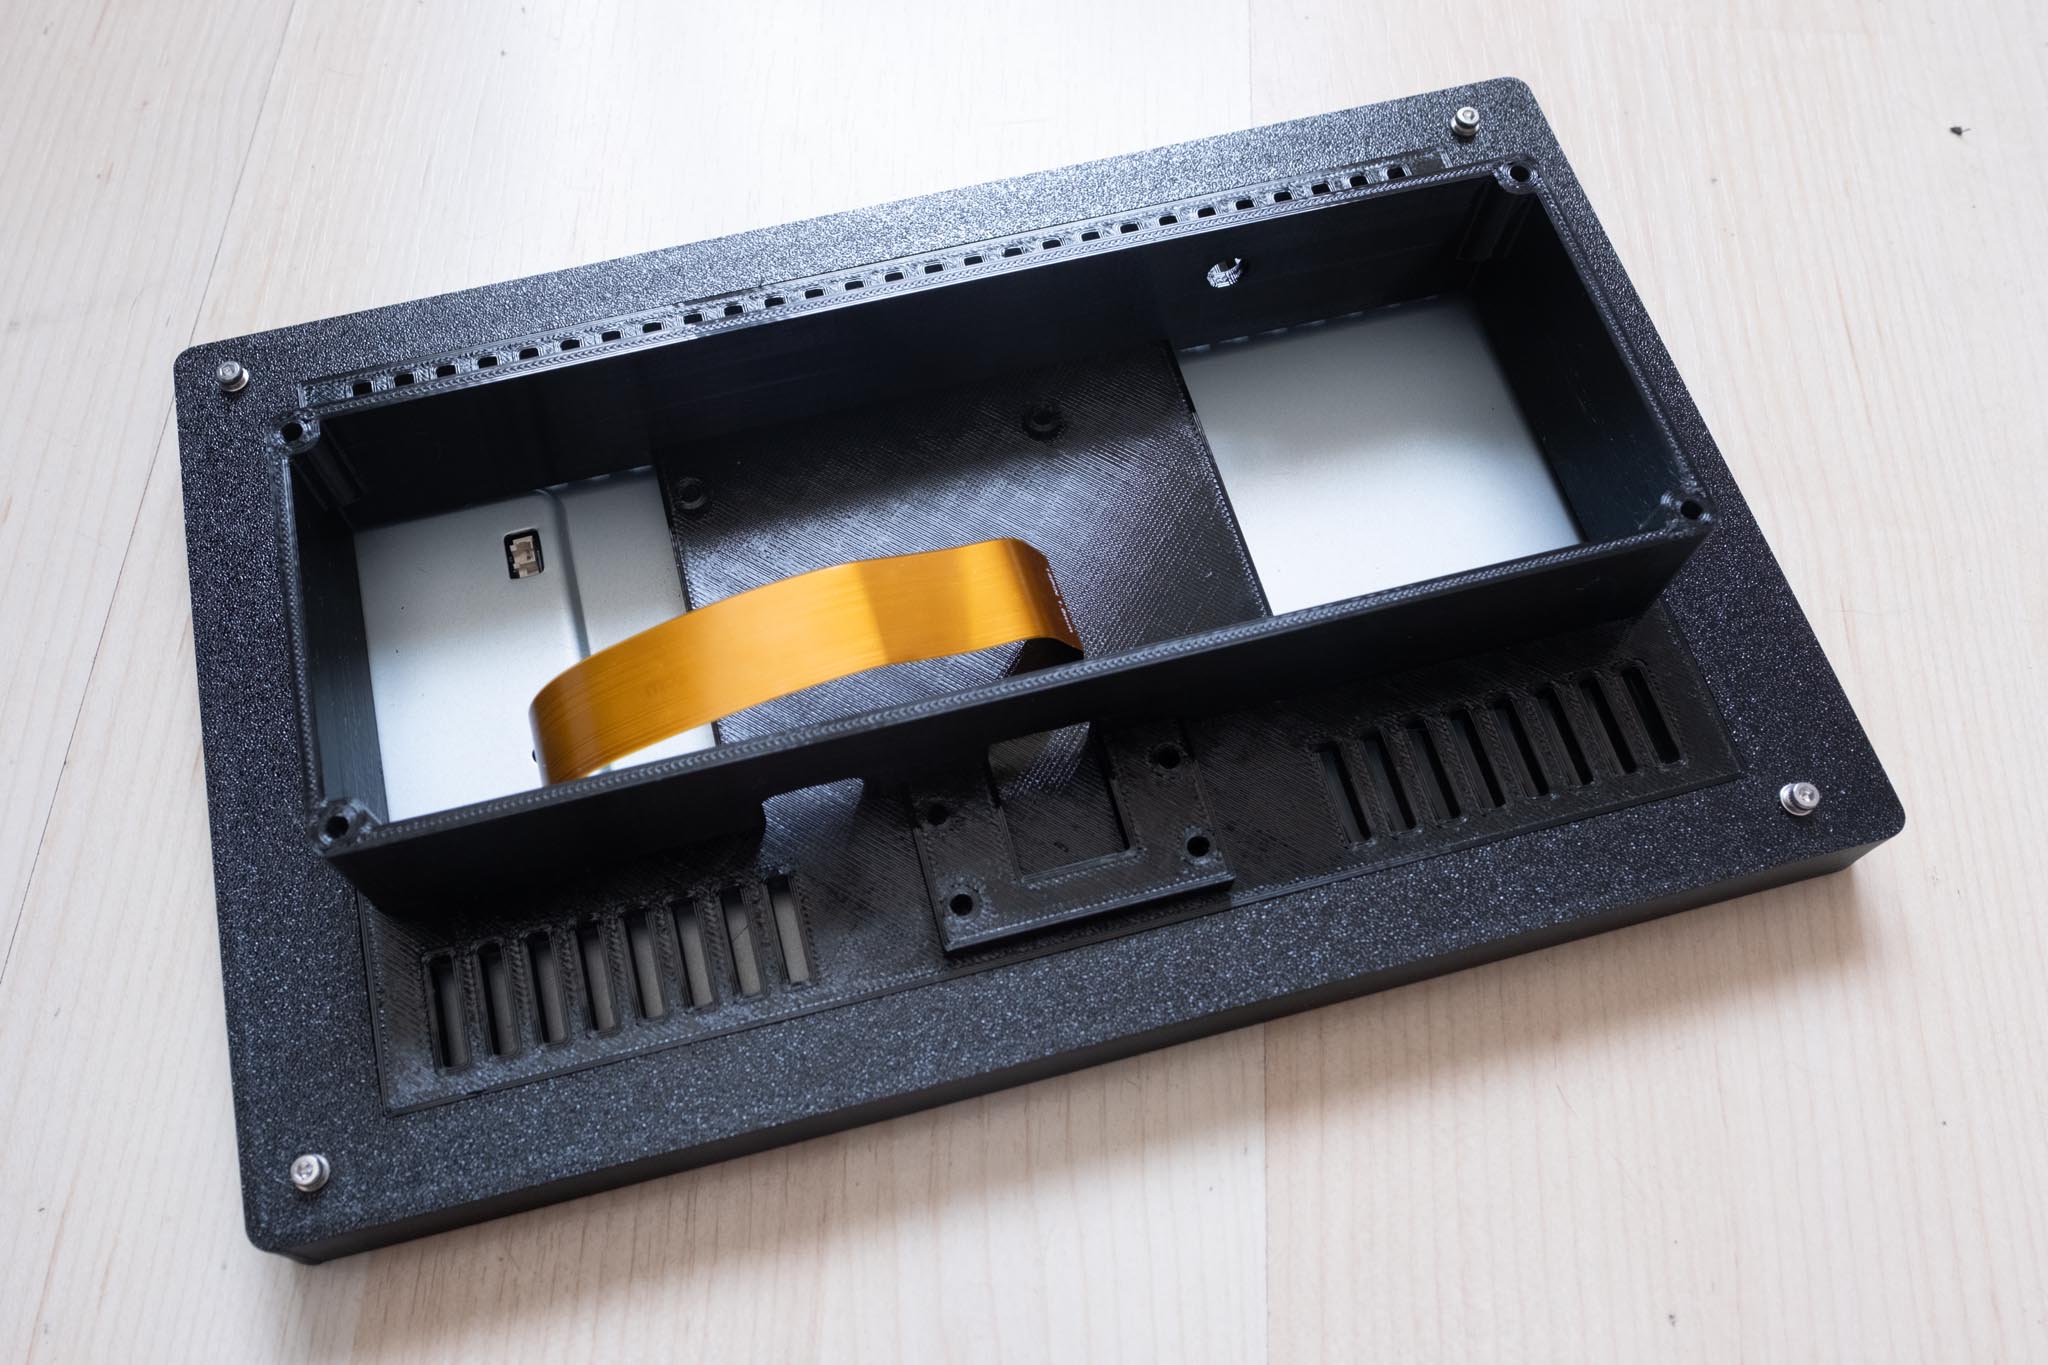
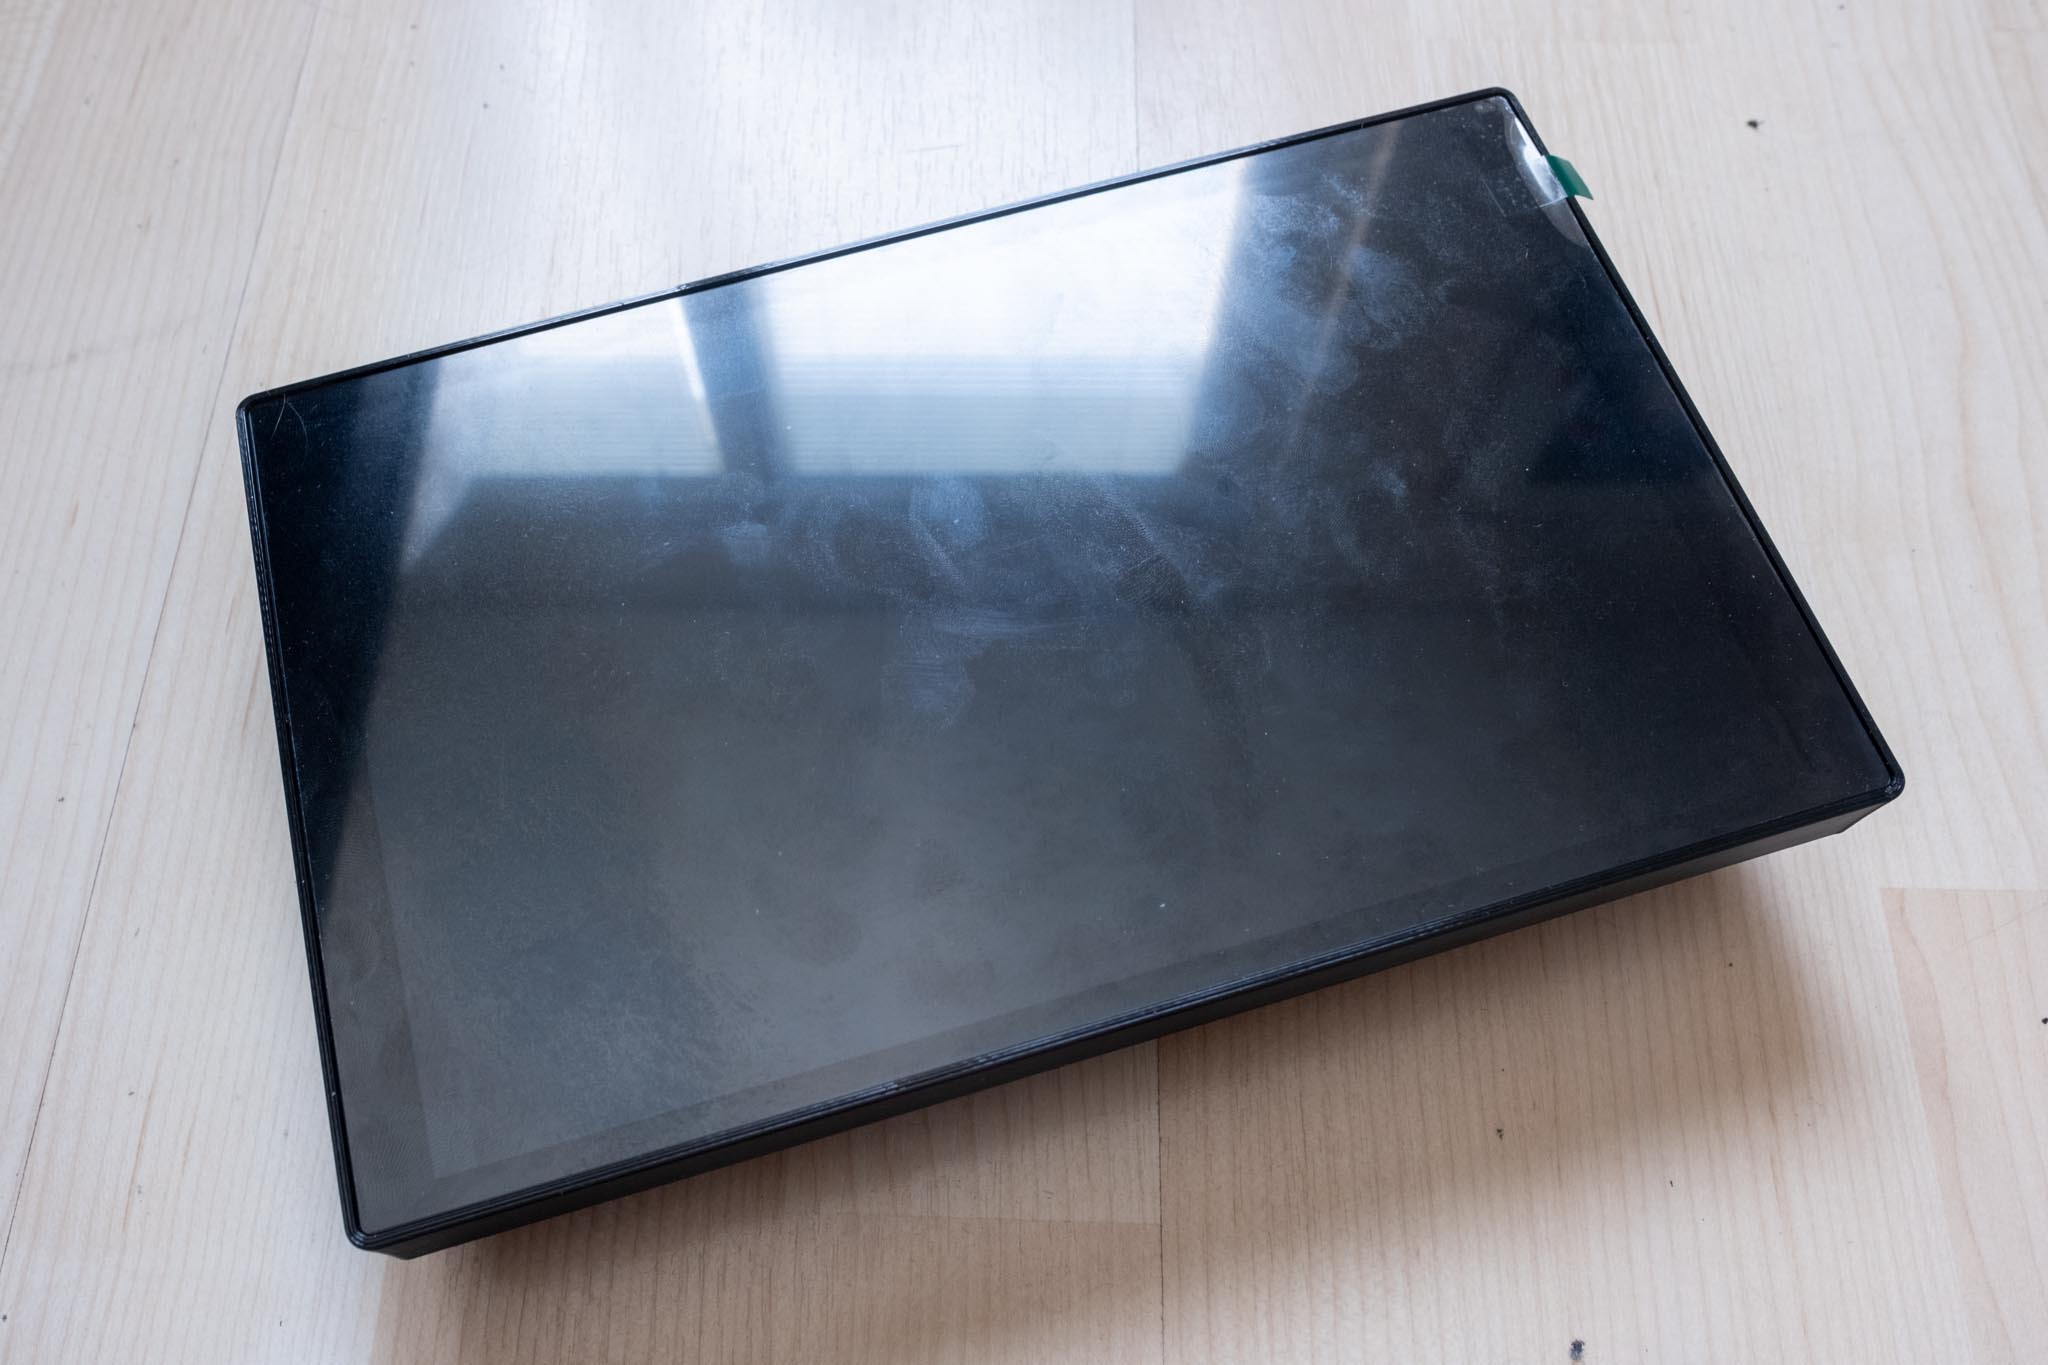
The base houses the light and radar sensor, since I wanted to keep the frame of the display as narrow as possible. Here, too, I needed several attempts, since the display was top-heavy at first and the weather station tipped over easily. In the base there are heat-set inserts for the sensor boards, which in hindsight was not the best idea. When melting them in, you have to be very careful not to touch the edges with the soldering iron, and they must also not be soldered in even a little too deep, because otherwise you see small bumps on the front. A normal drilled hole would have been completely sufficient here. For the 3D printing I used my new Snapmaker U1, and was thus able to produce the enclosure and the window for the sensors in a single print.
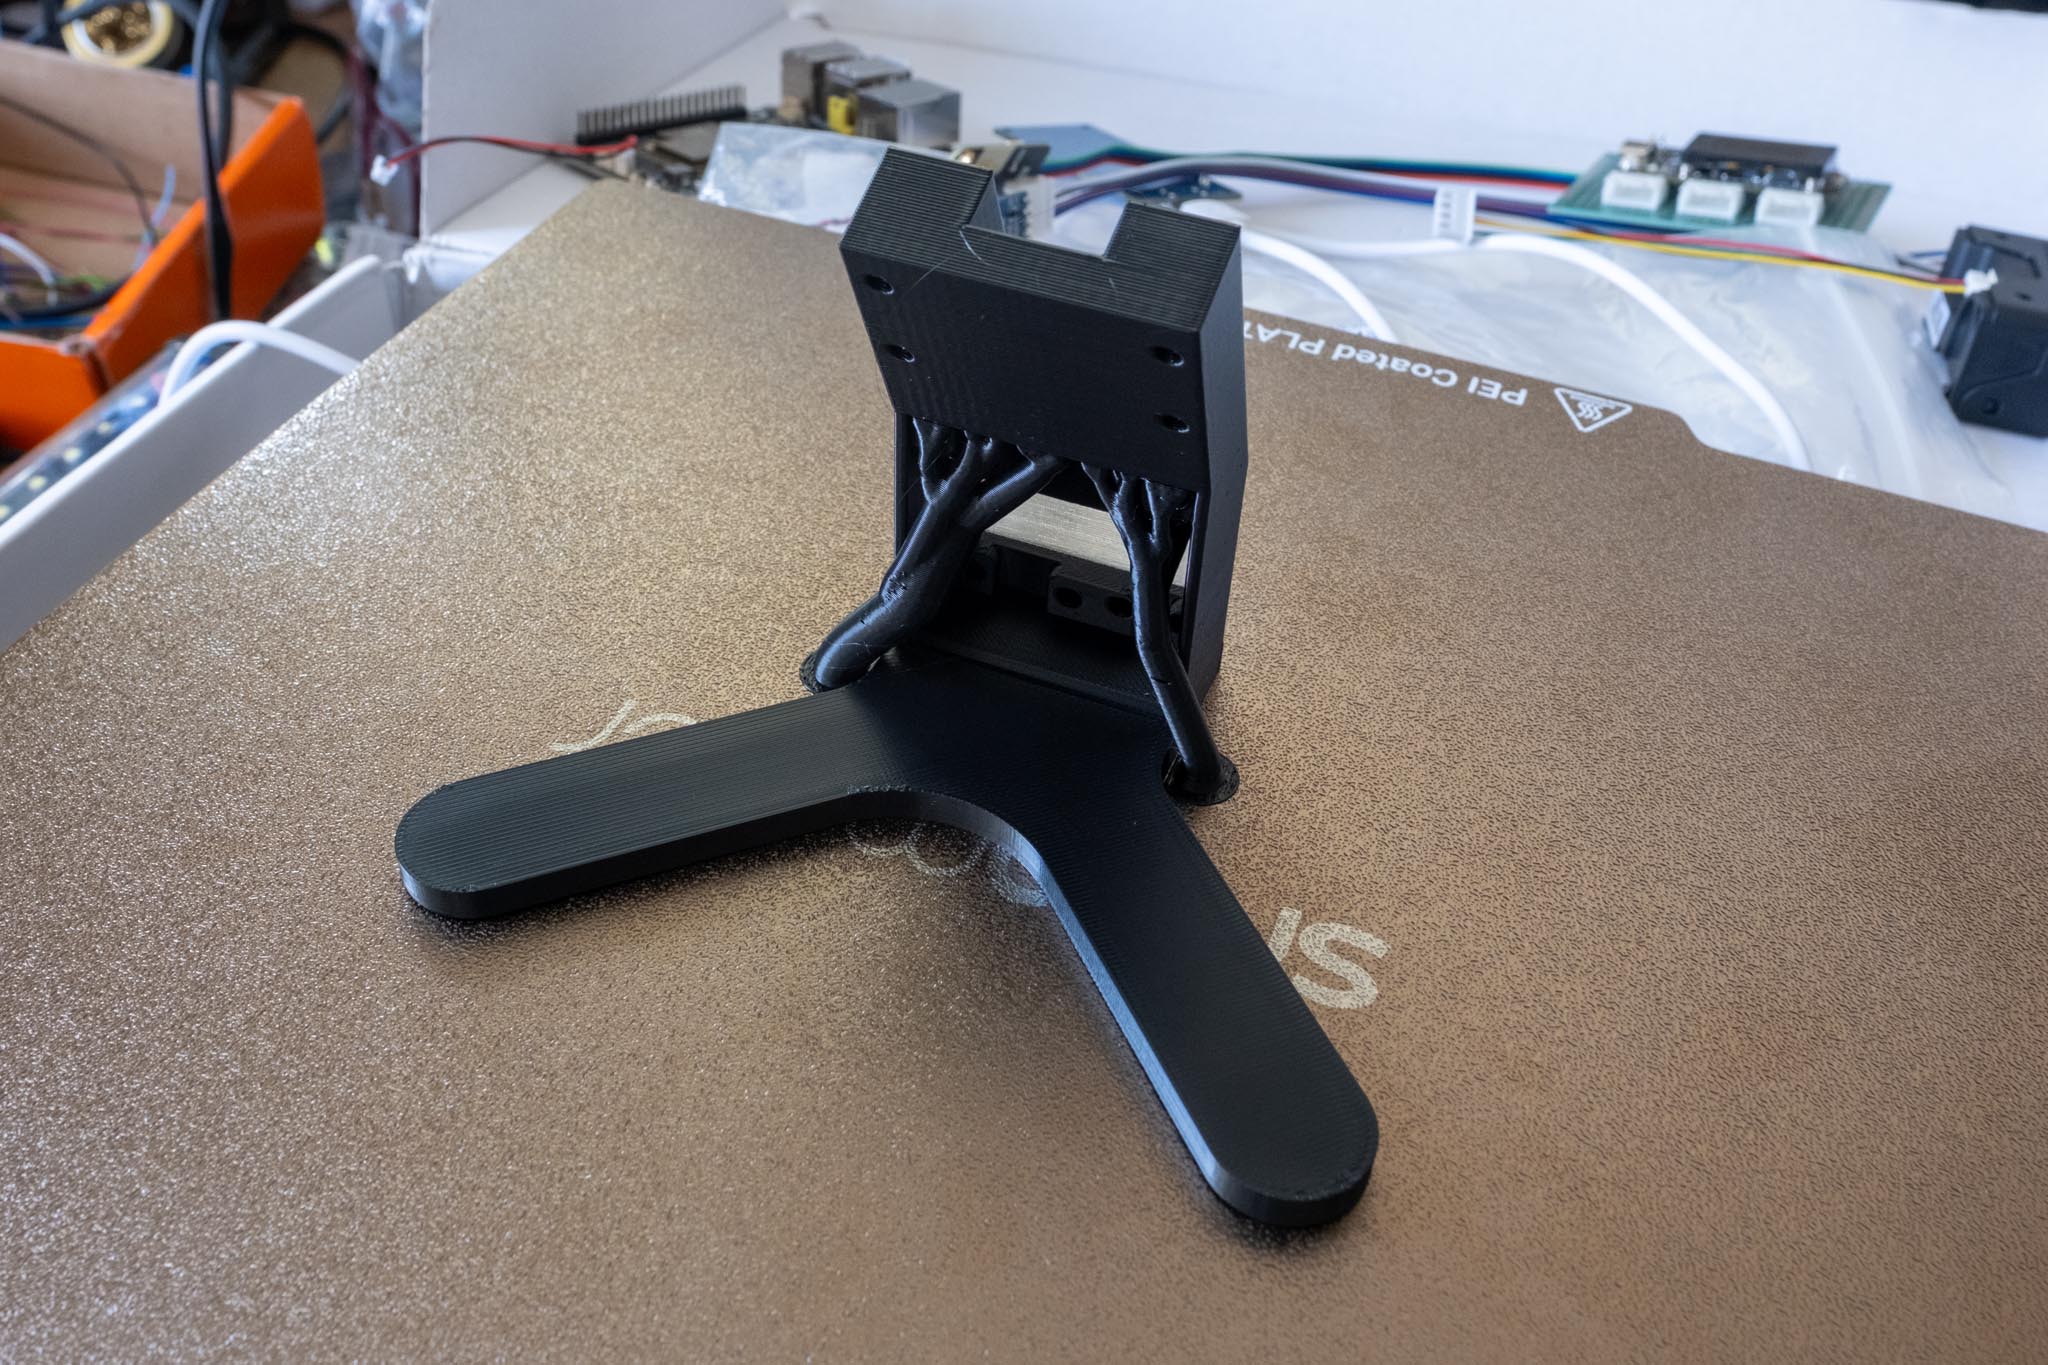
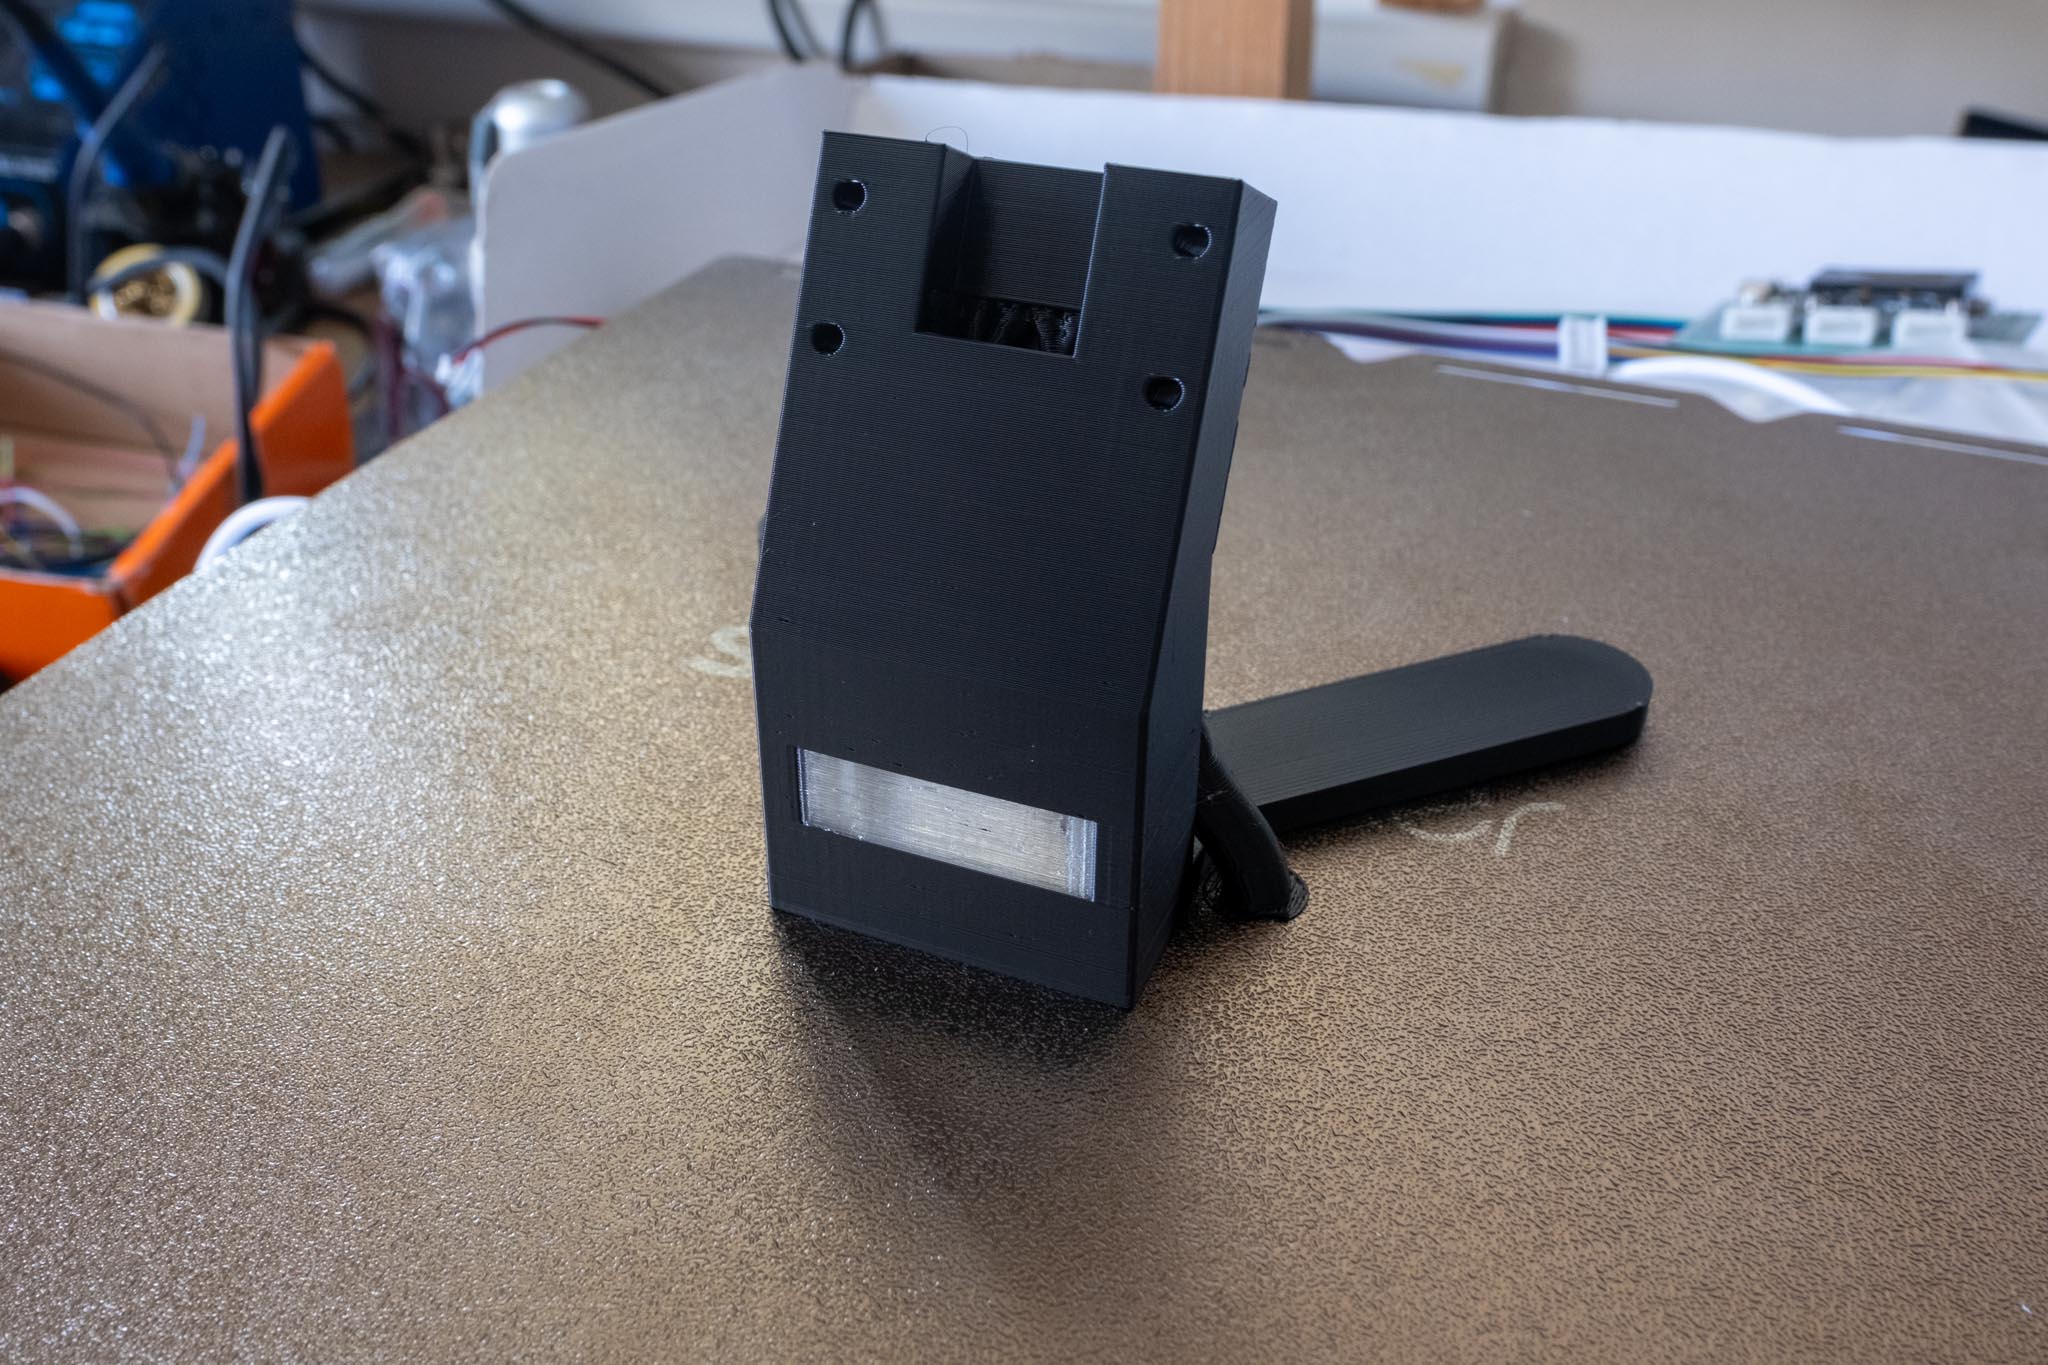
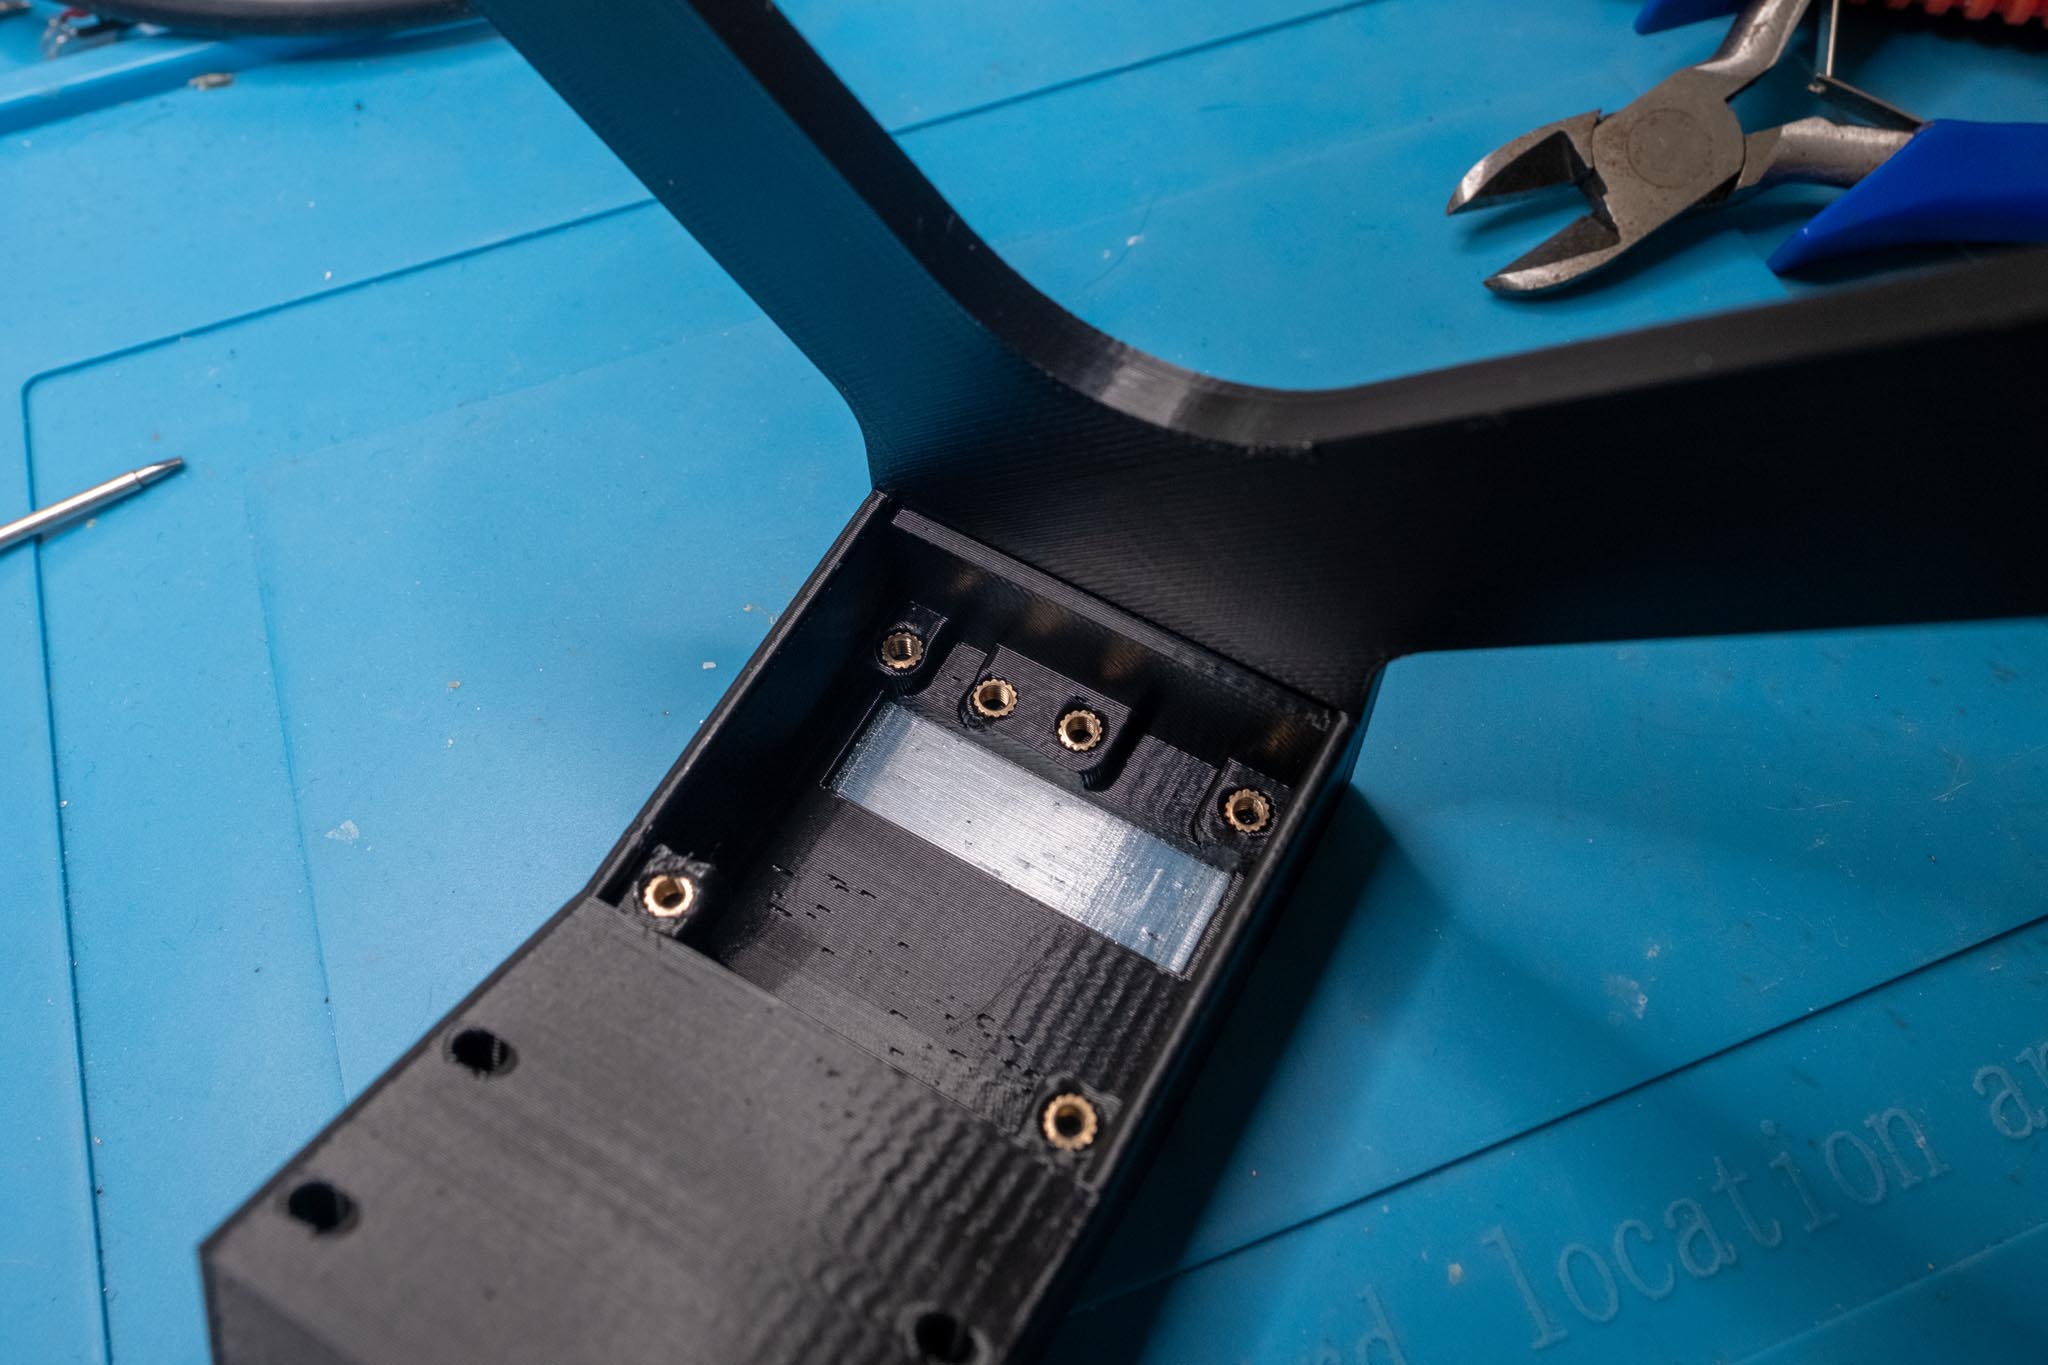
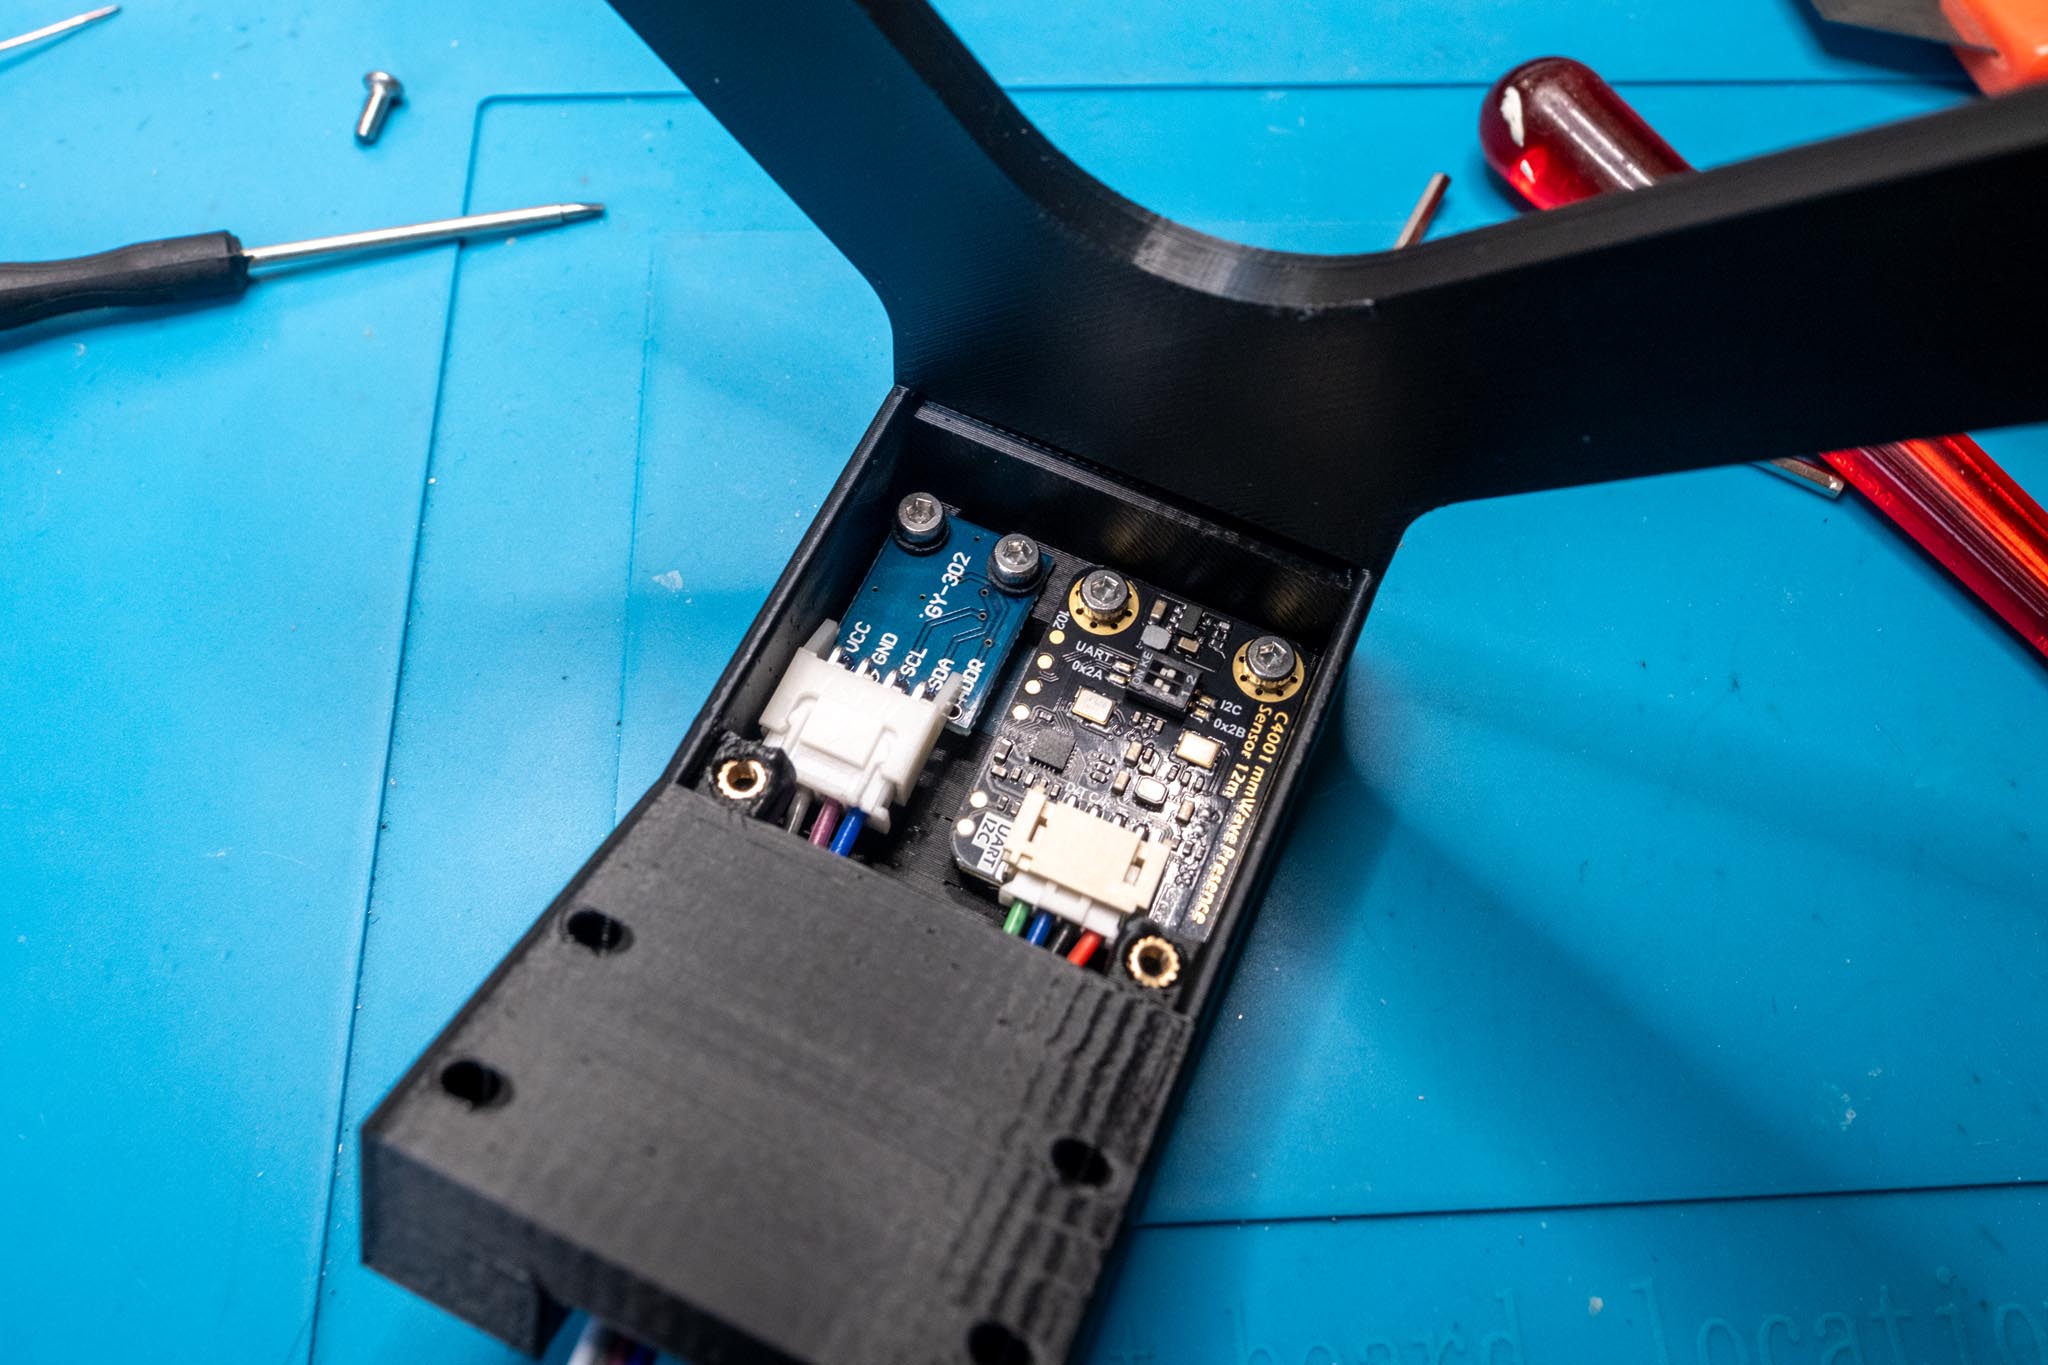
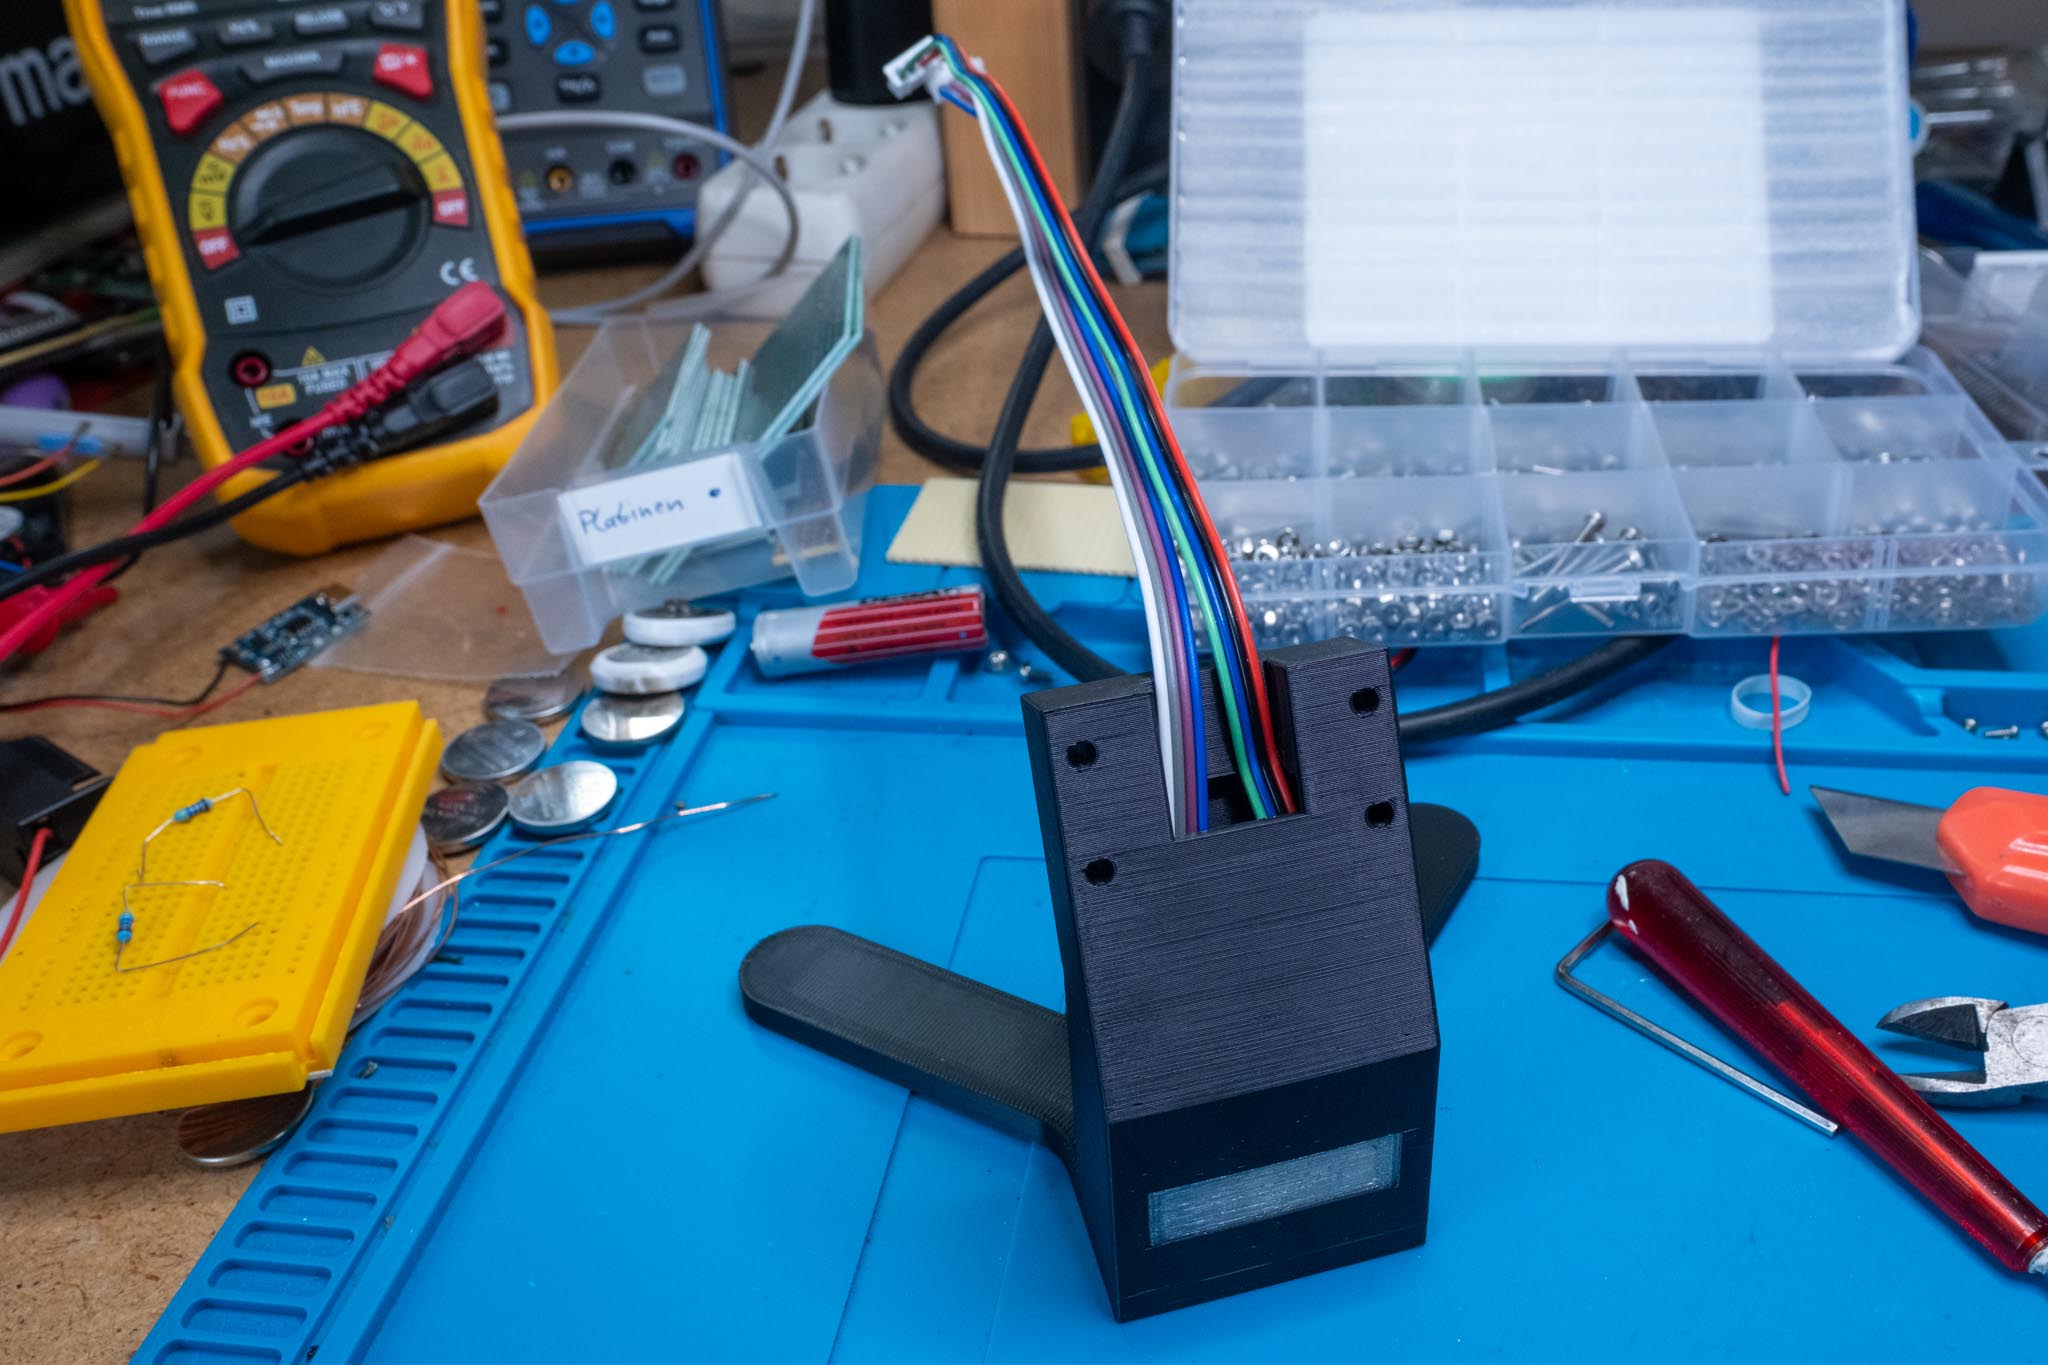
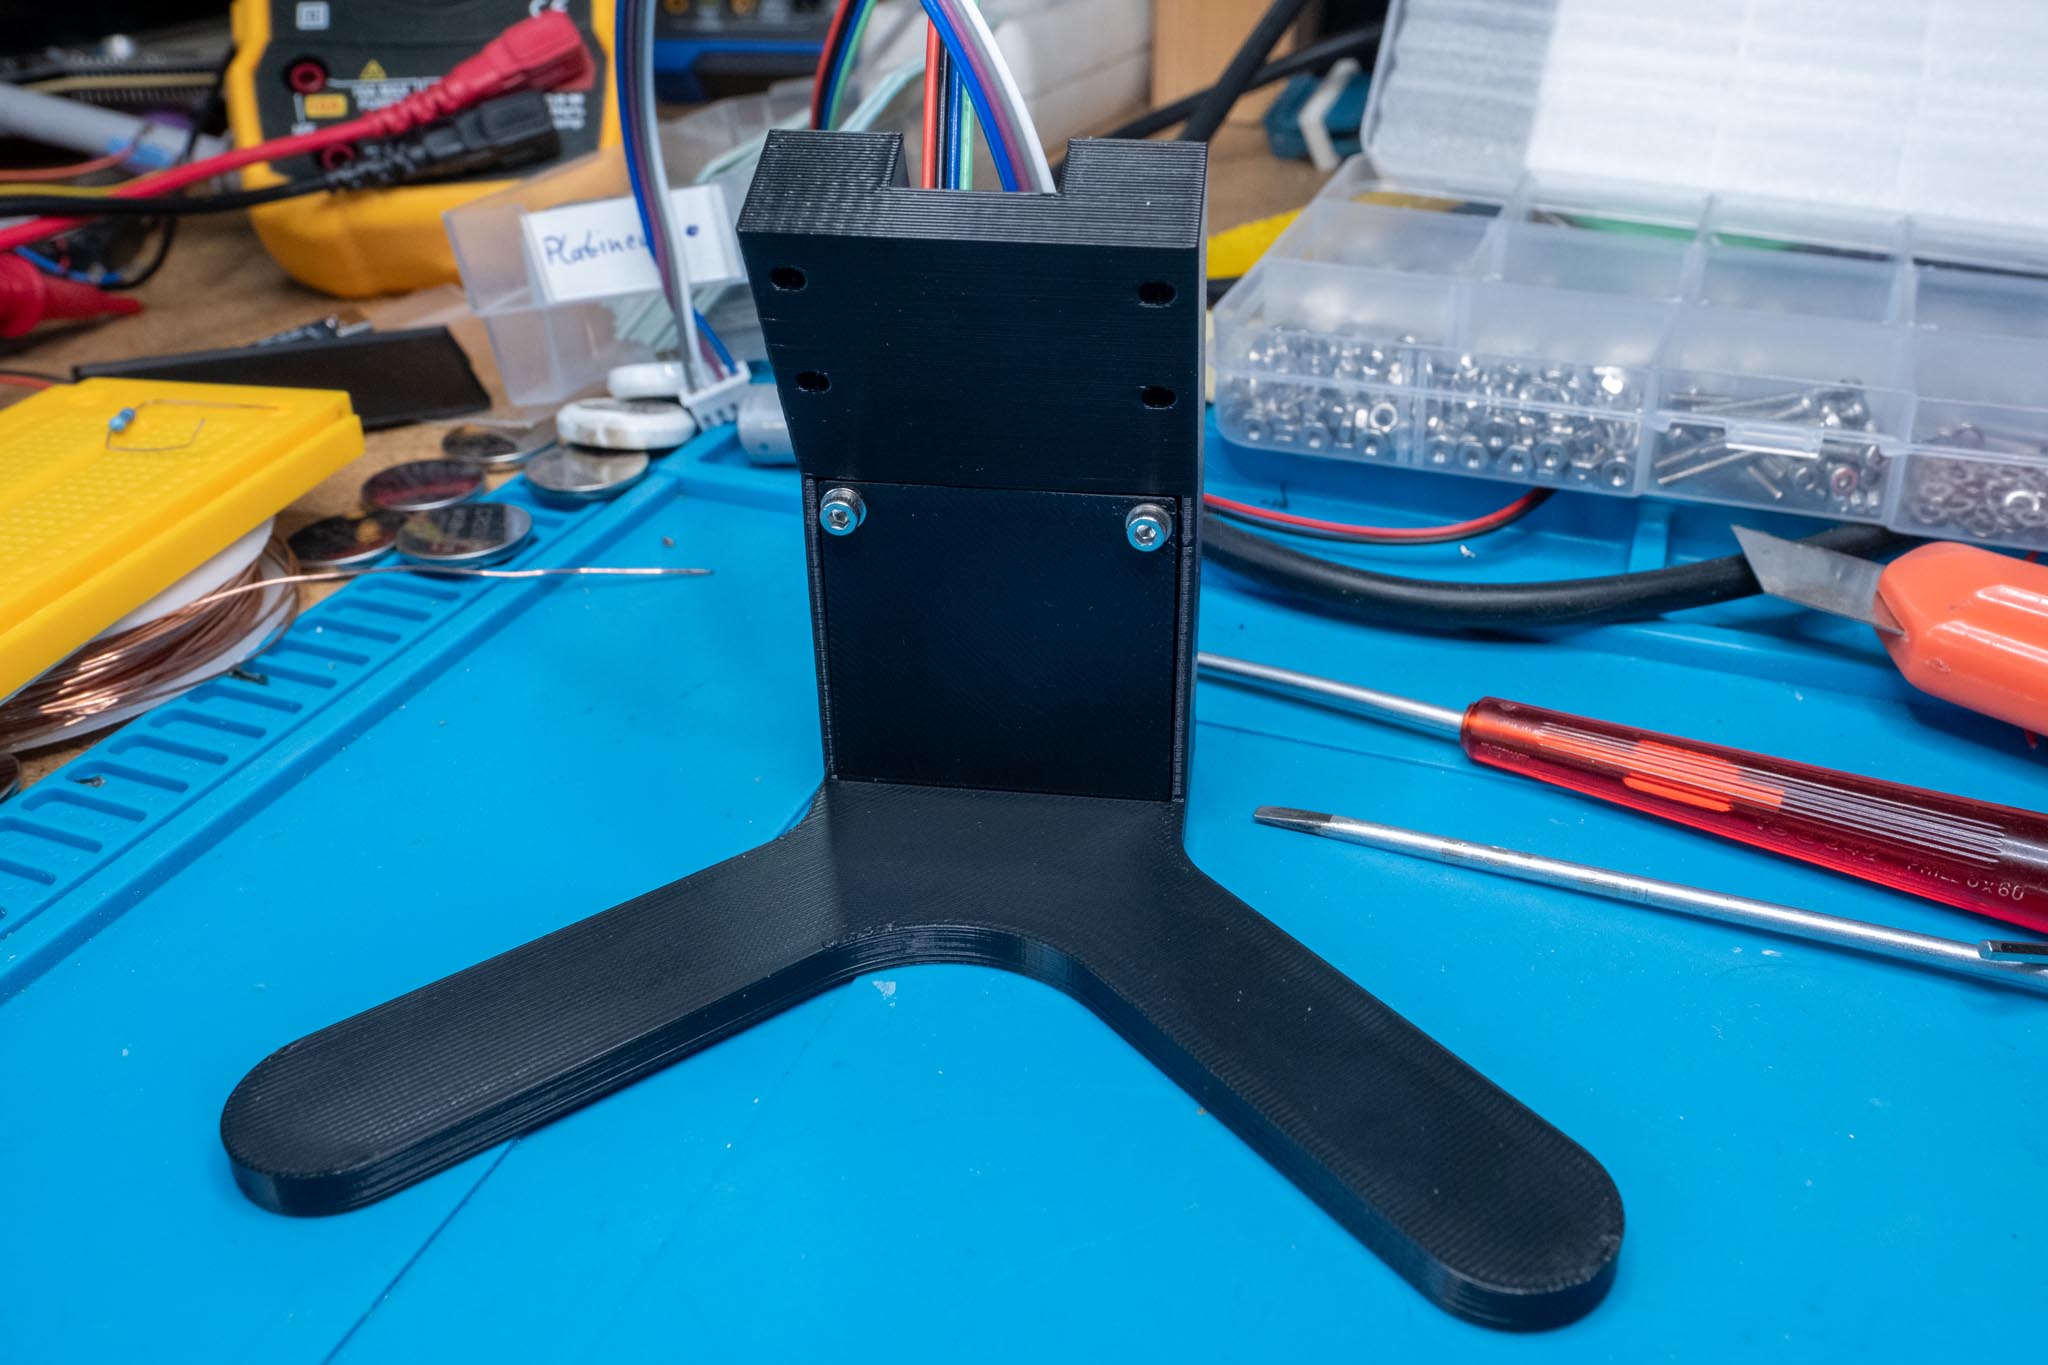
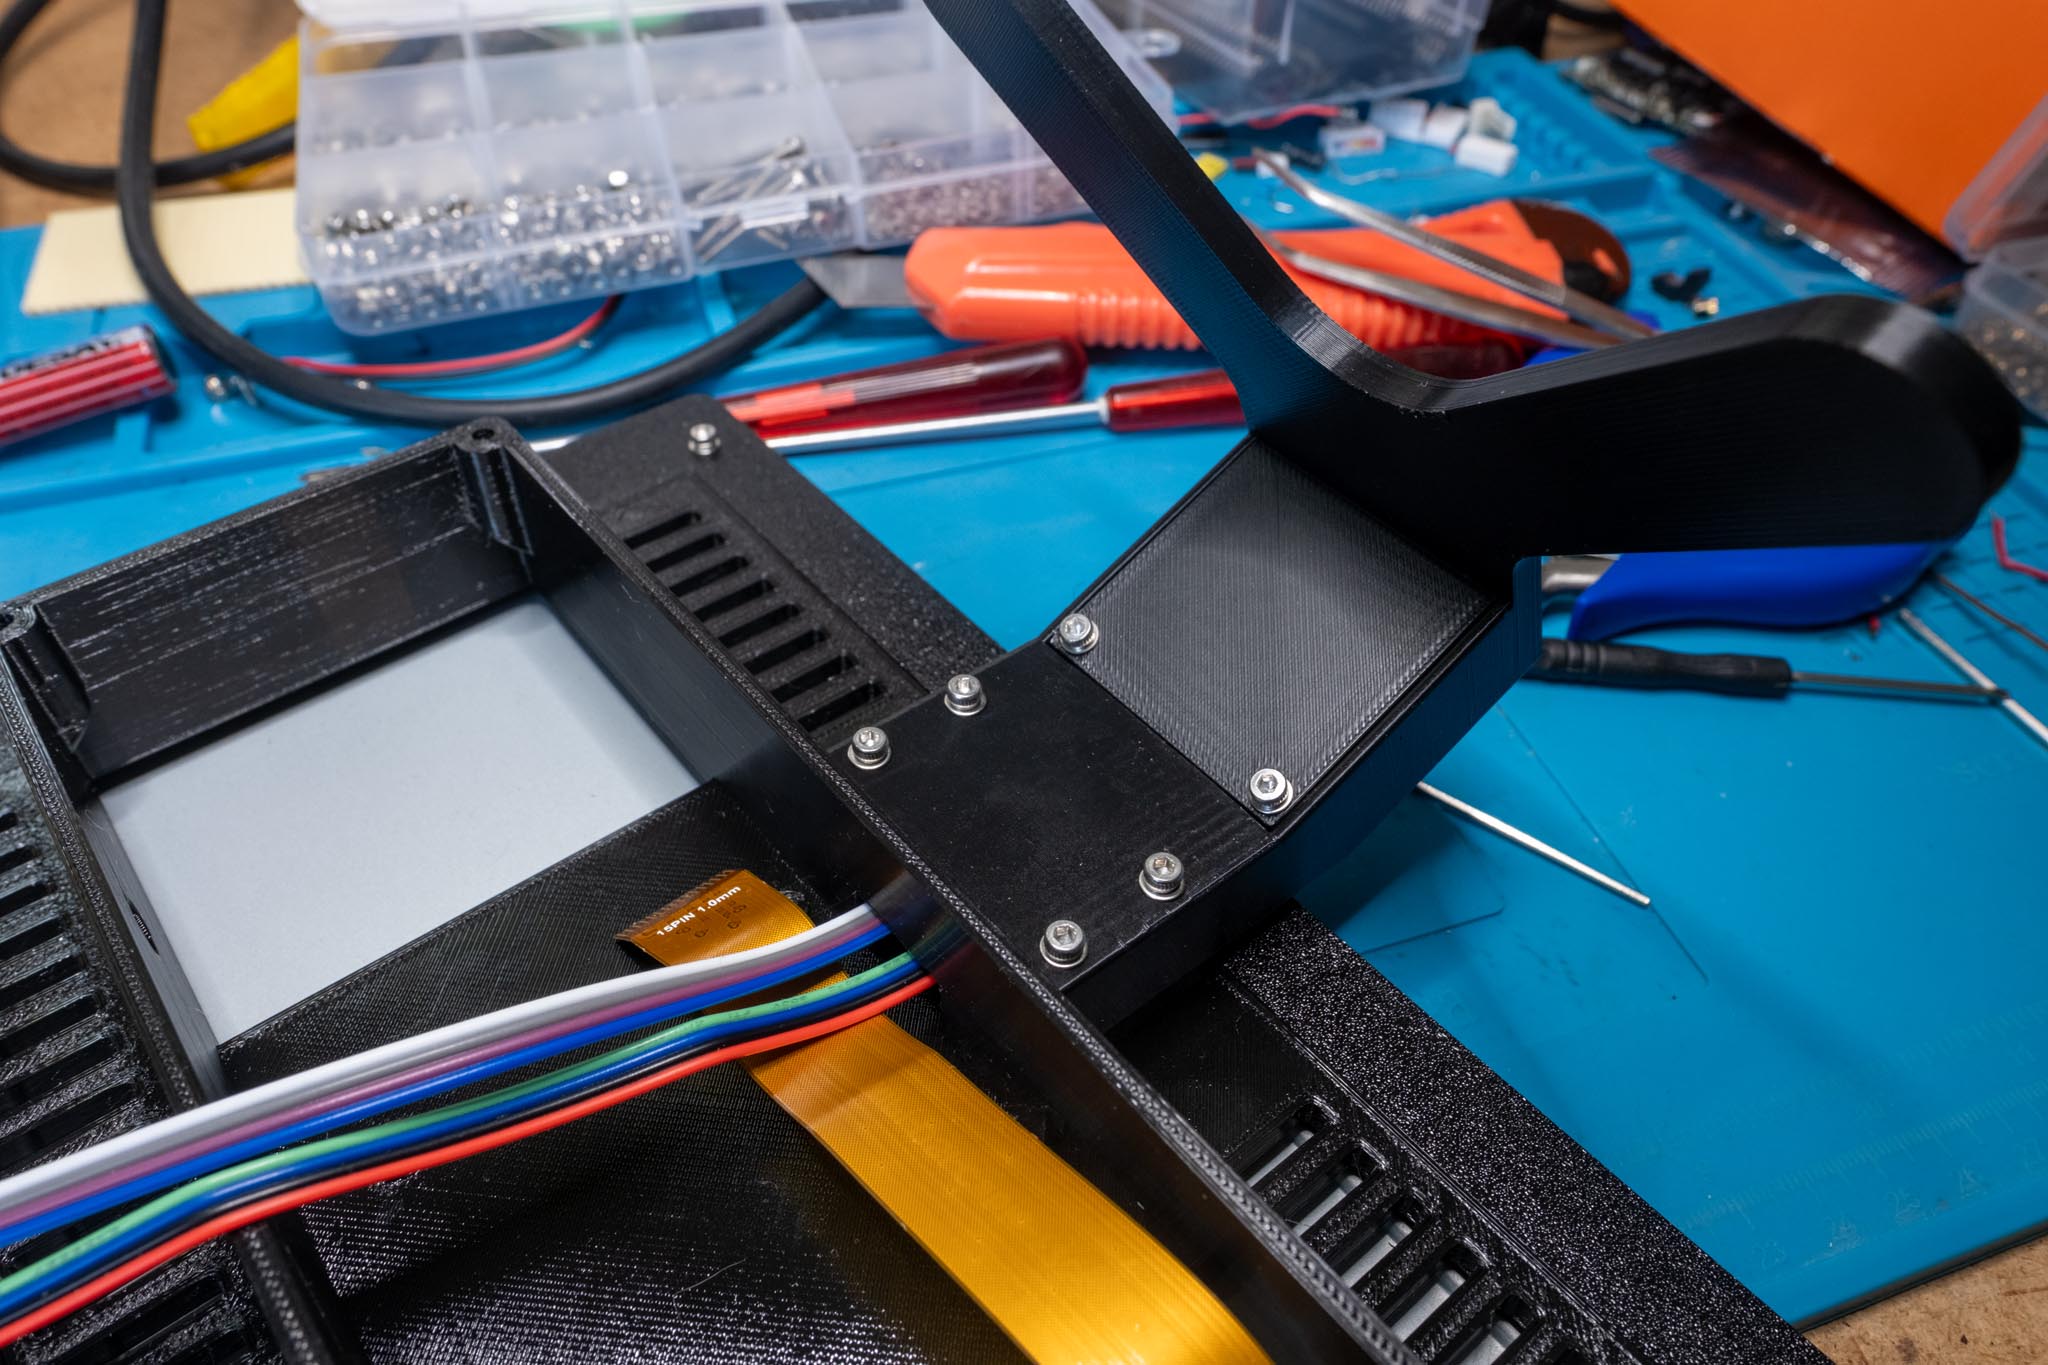
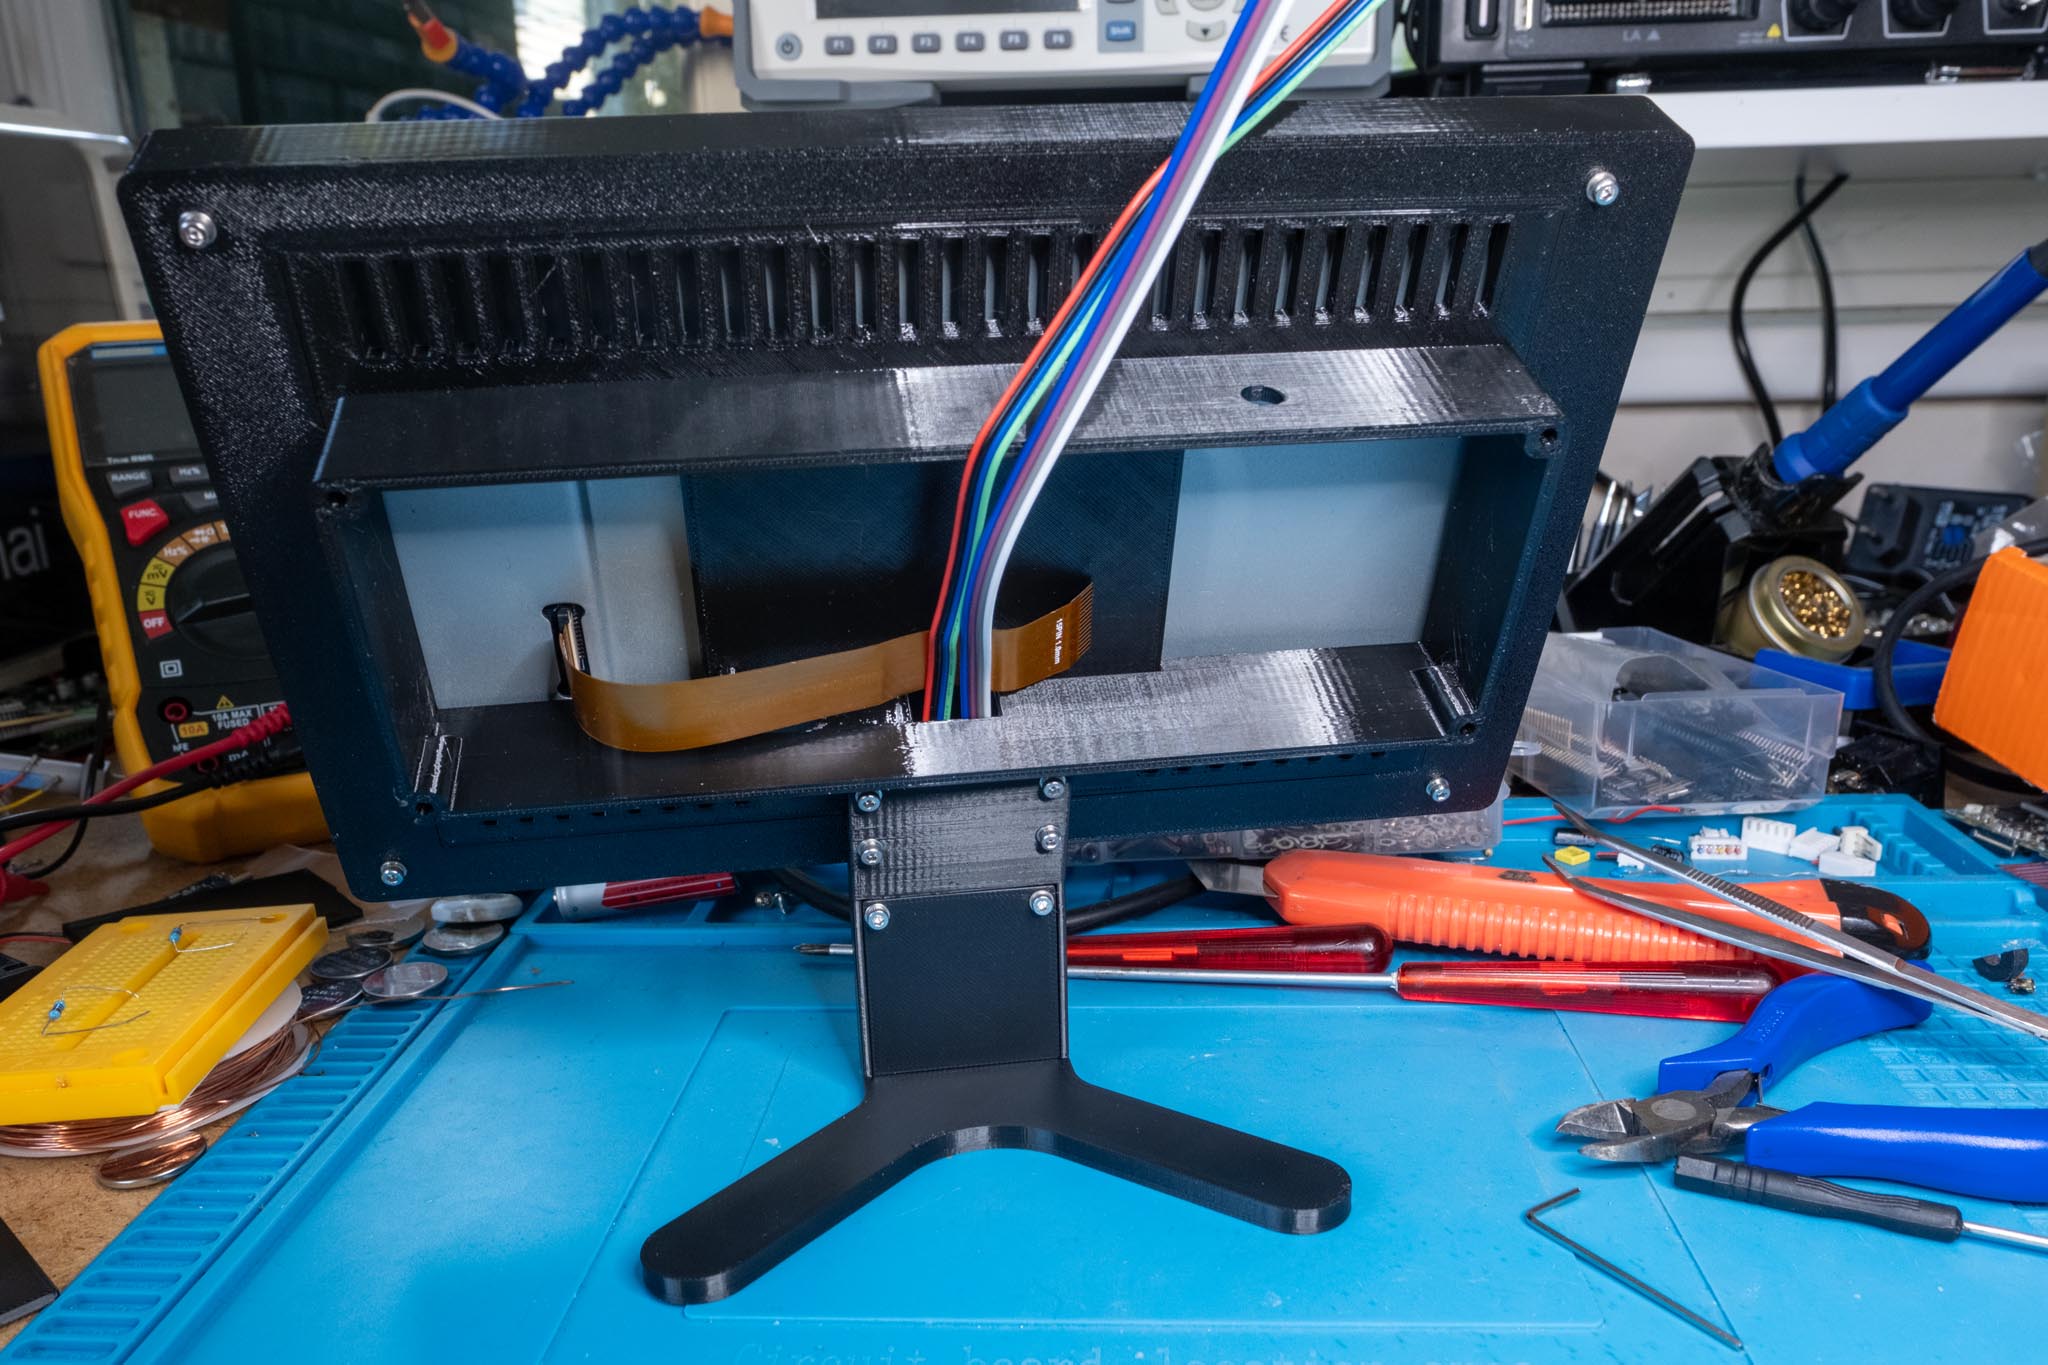
After assembling the display cover and the base, only the rear panel with the plugged-in SEN66 still has to be screwed on. For the mount of the SEN66 I used the reference design from Sensirion. It does fit very well in principle, but you should not remove the SEN66 all too often, because the guides are quite thin and can break easily.
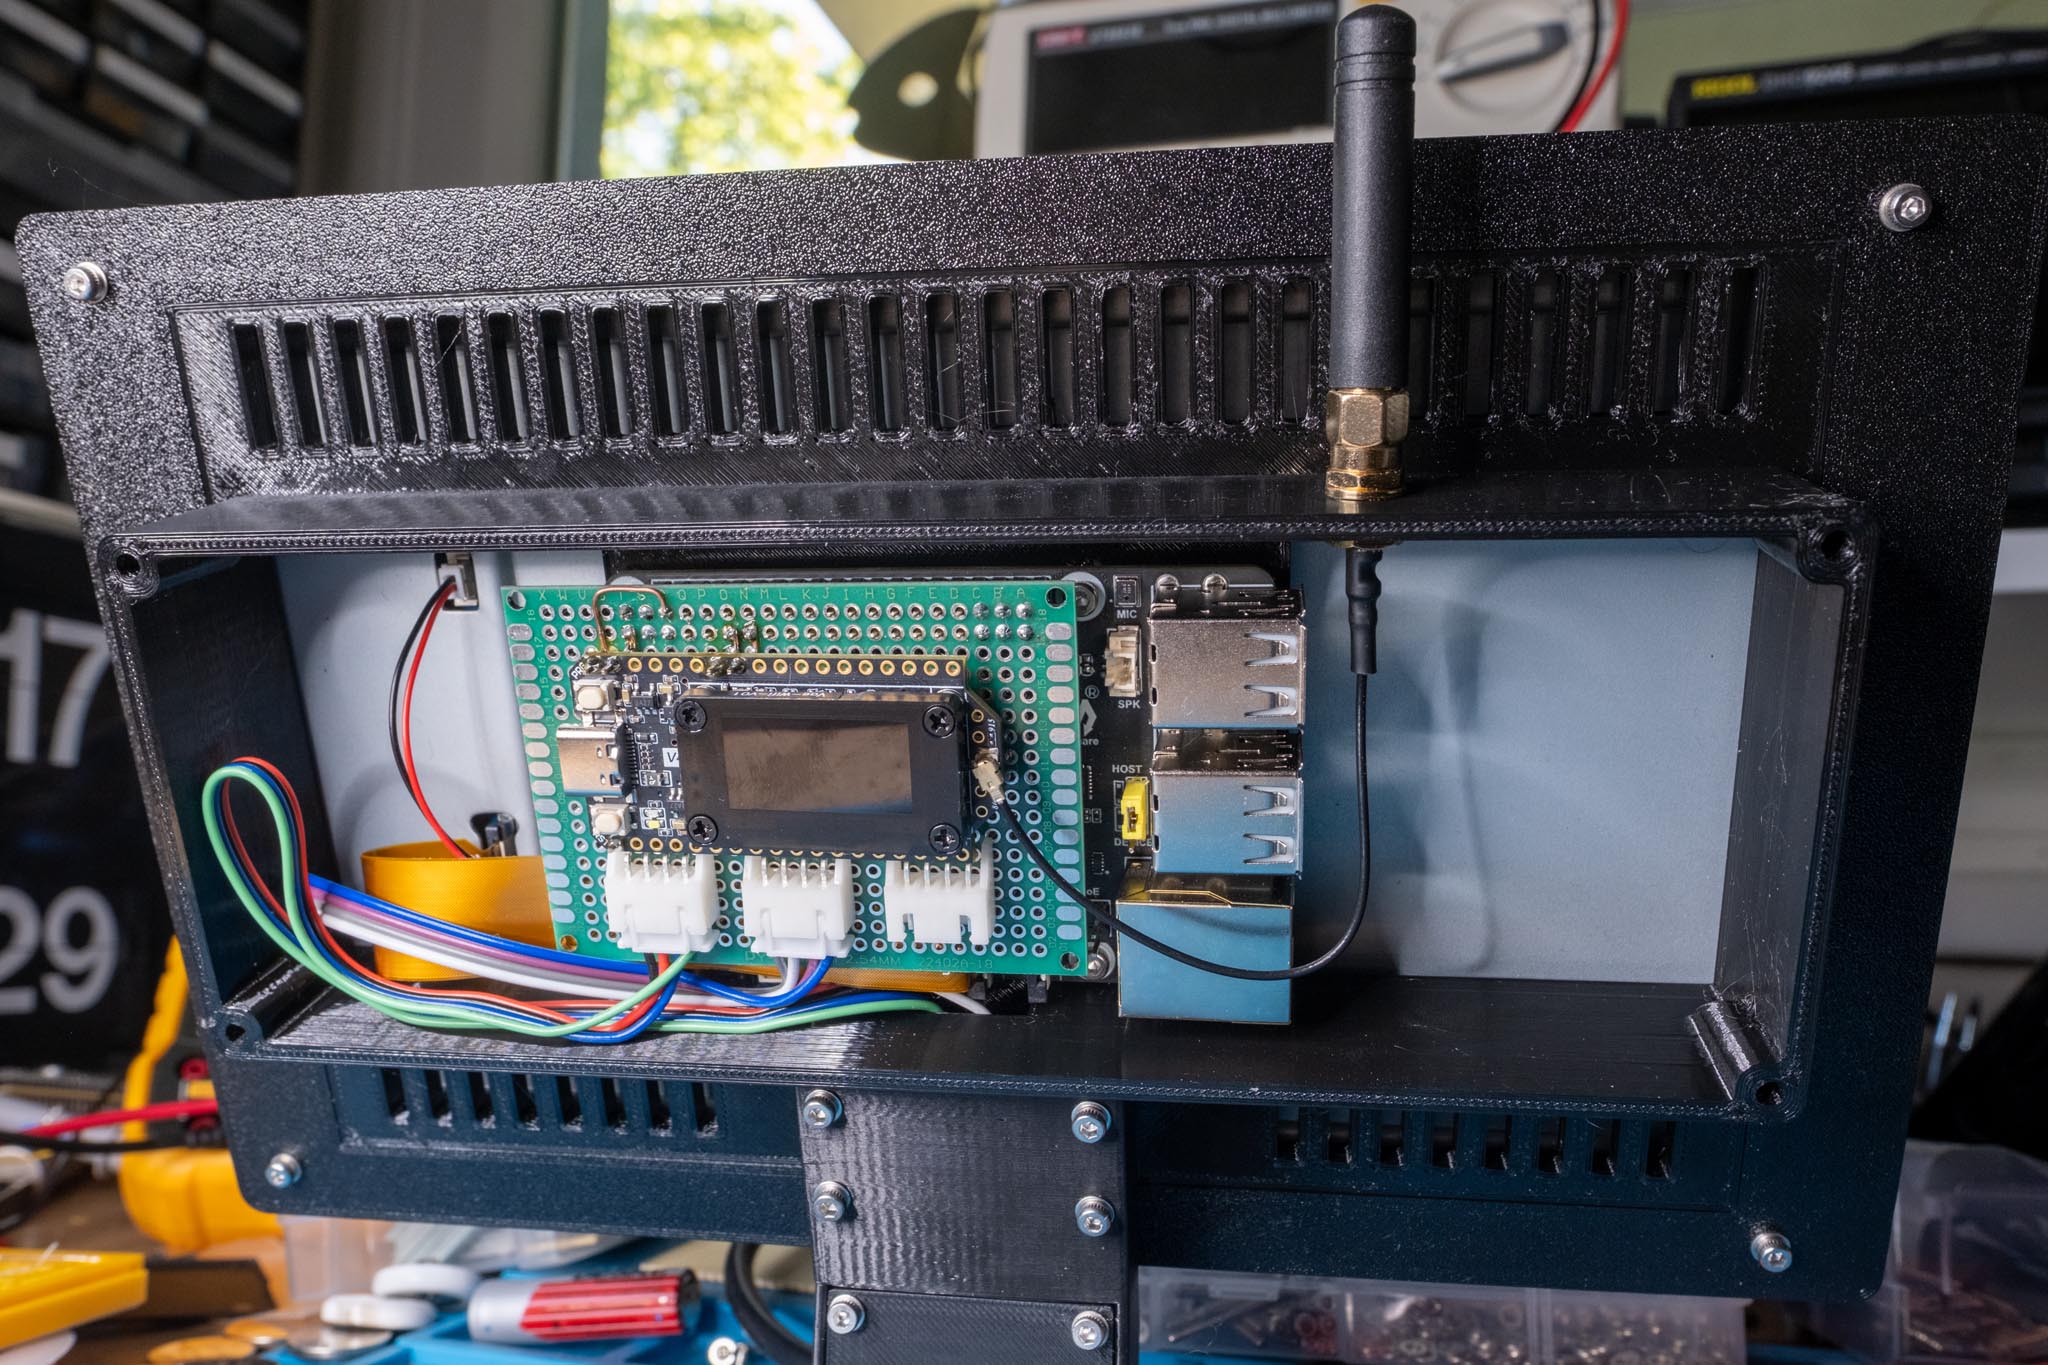
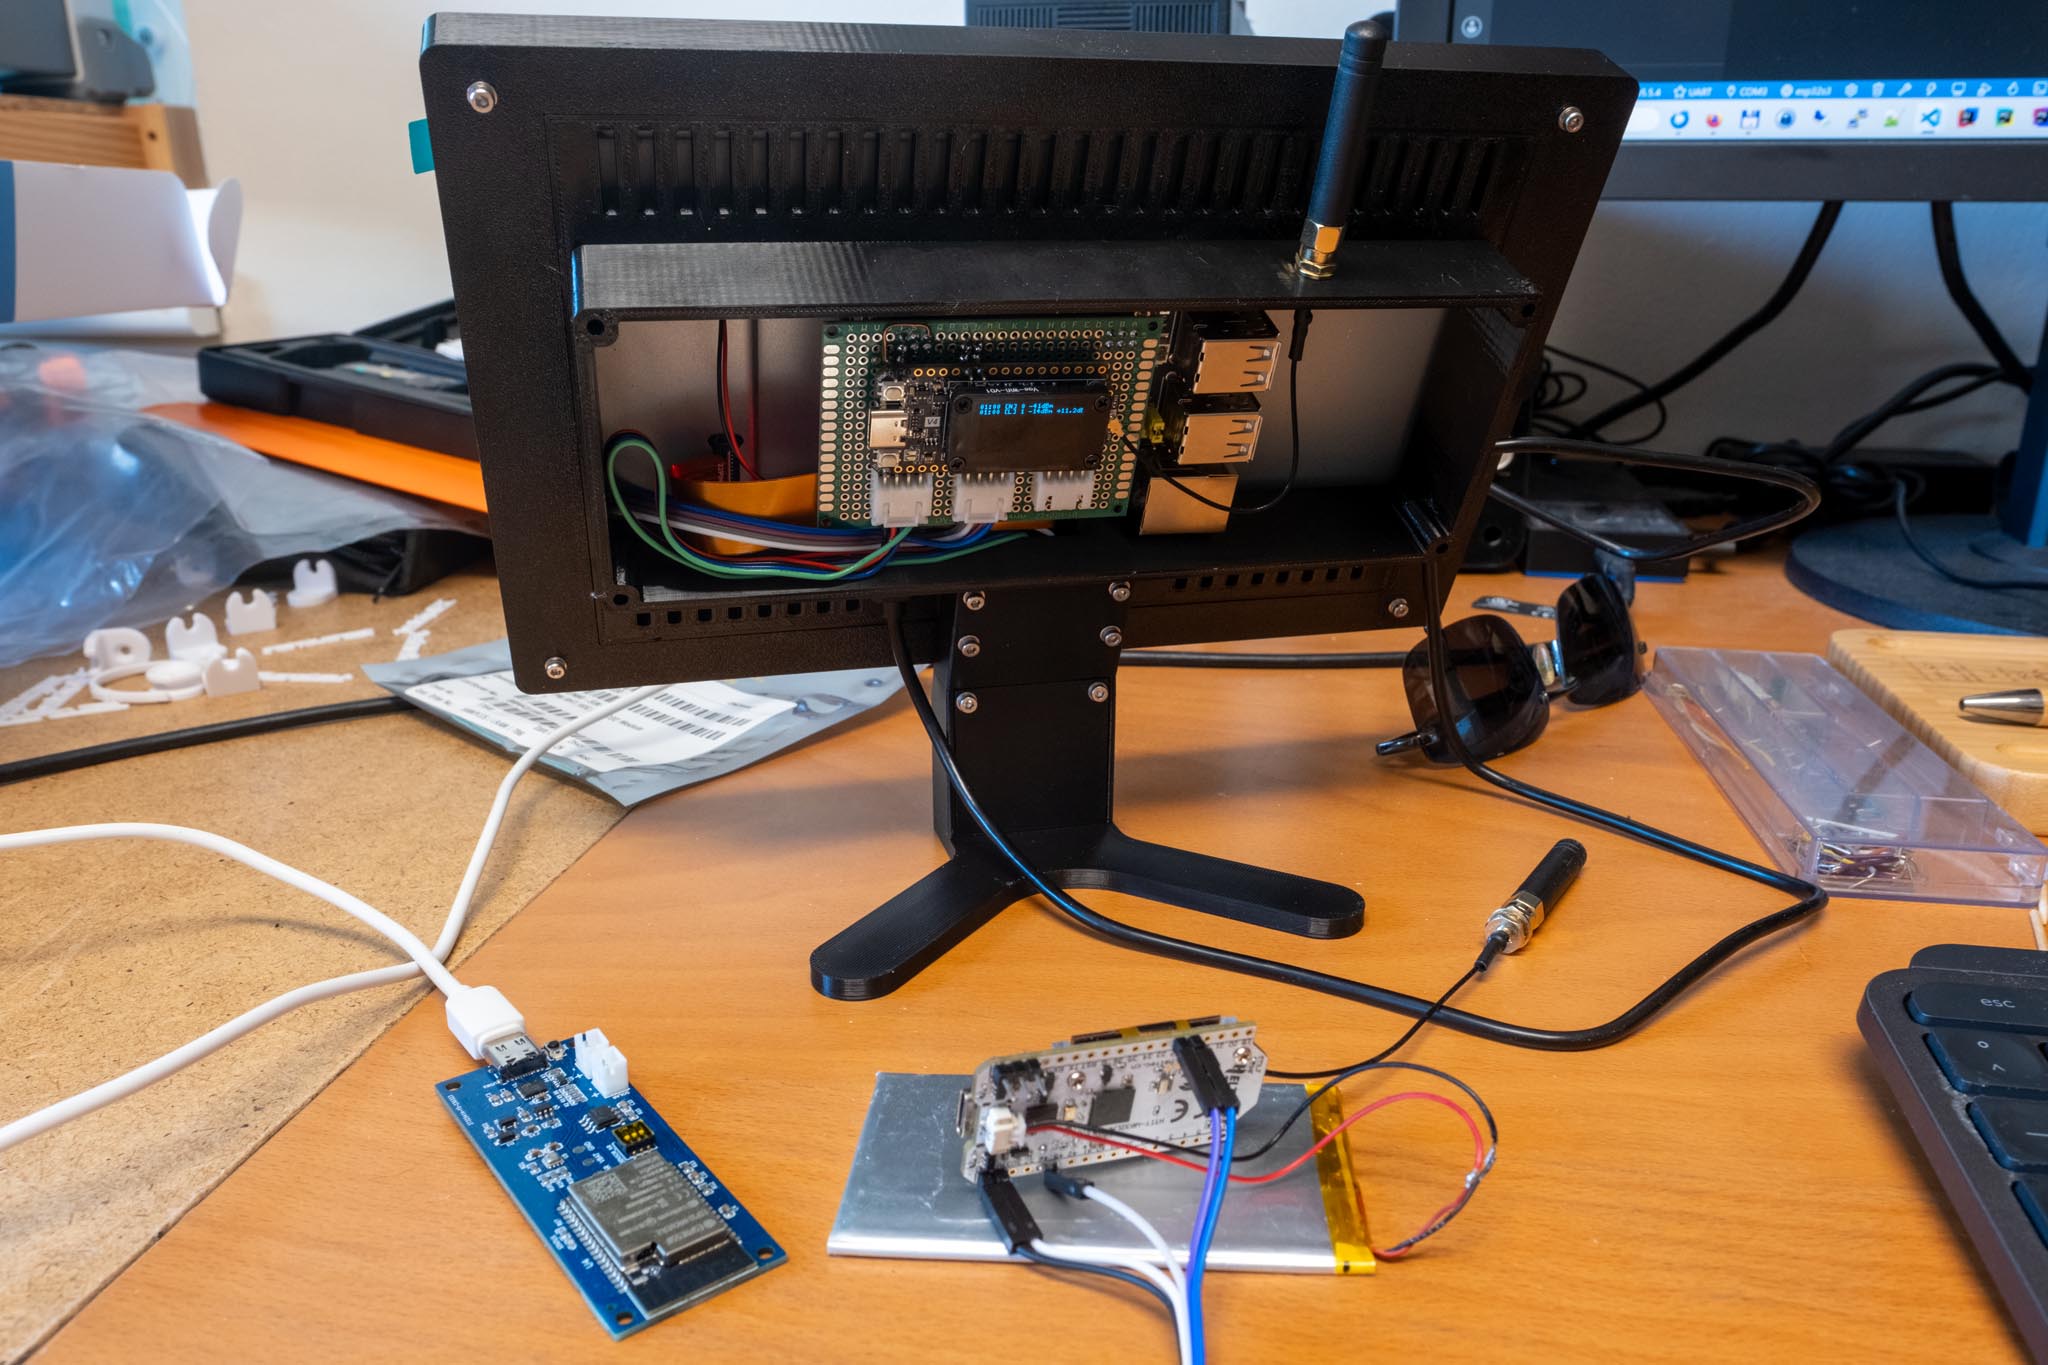
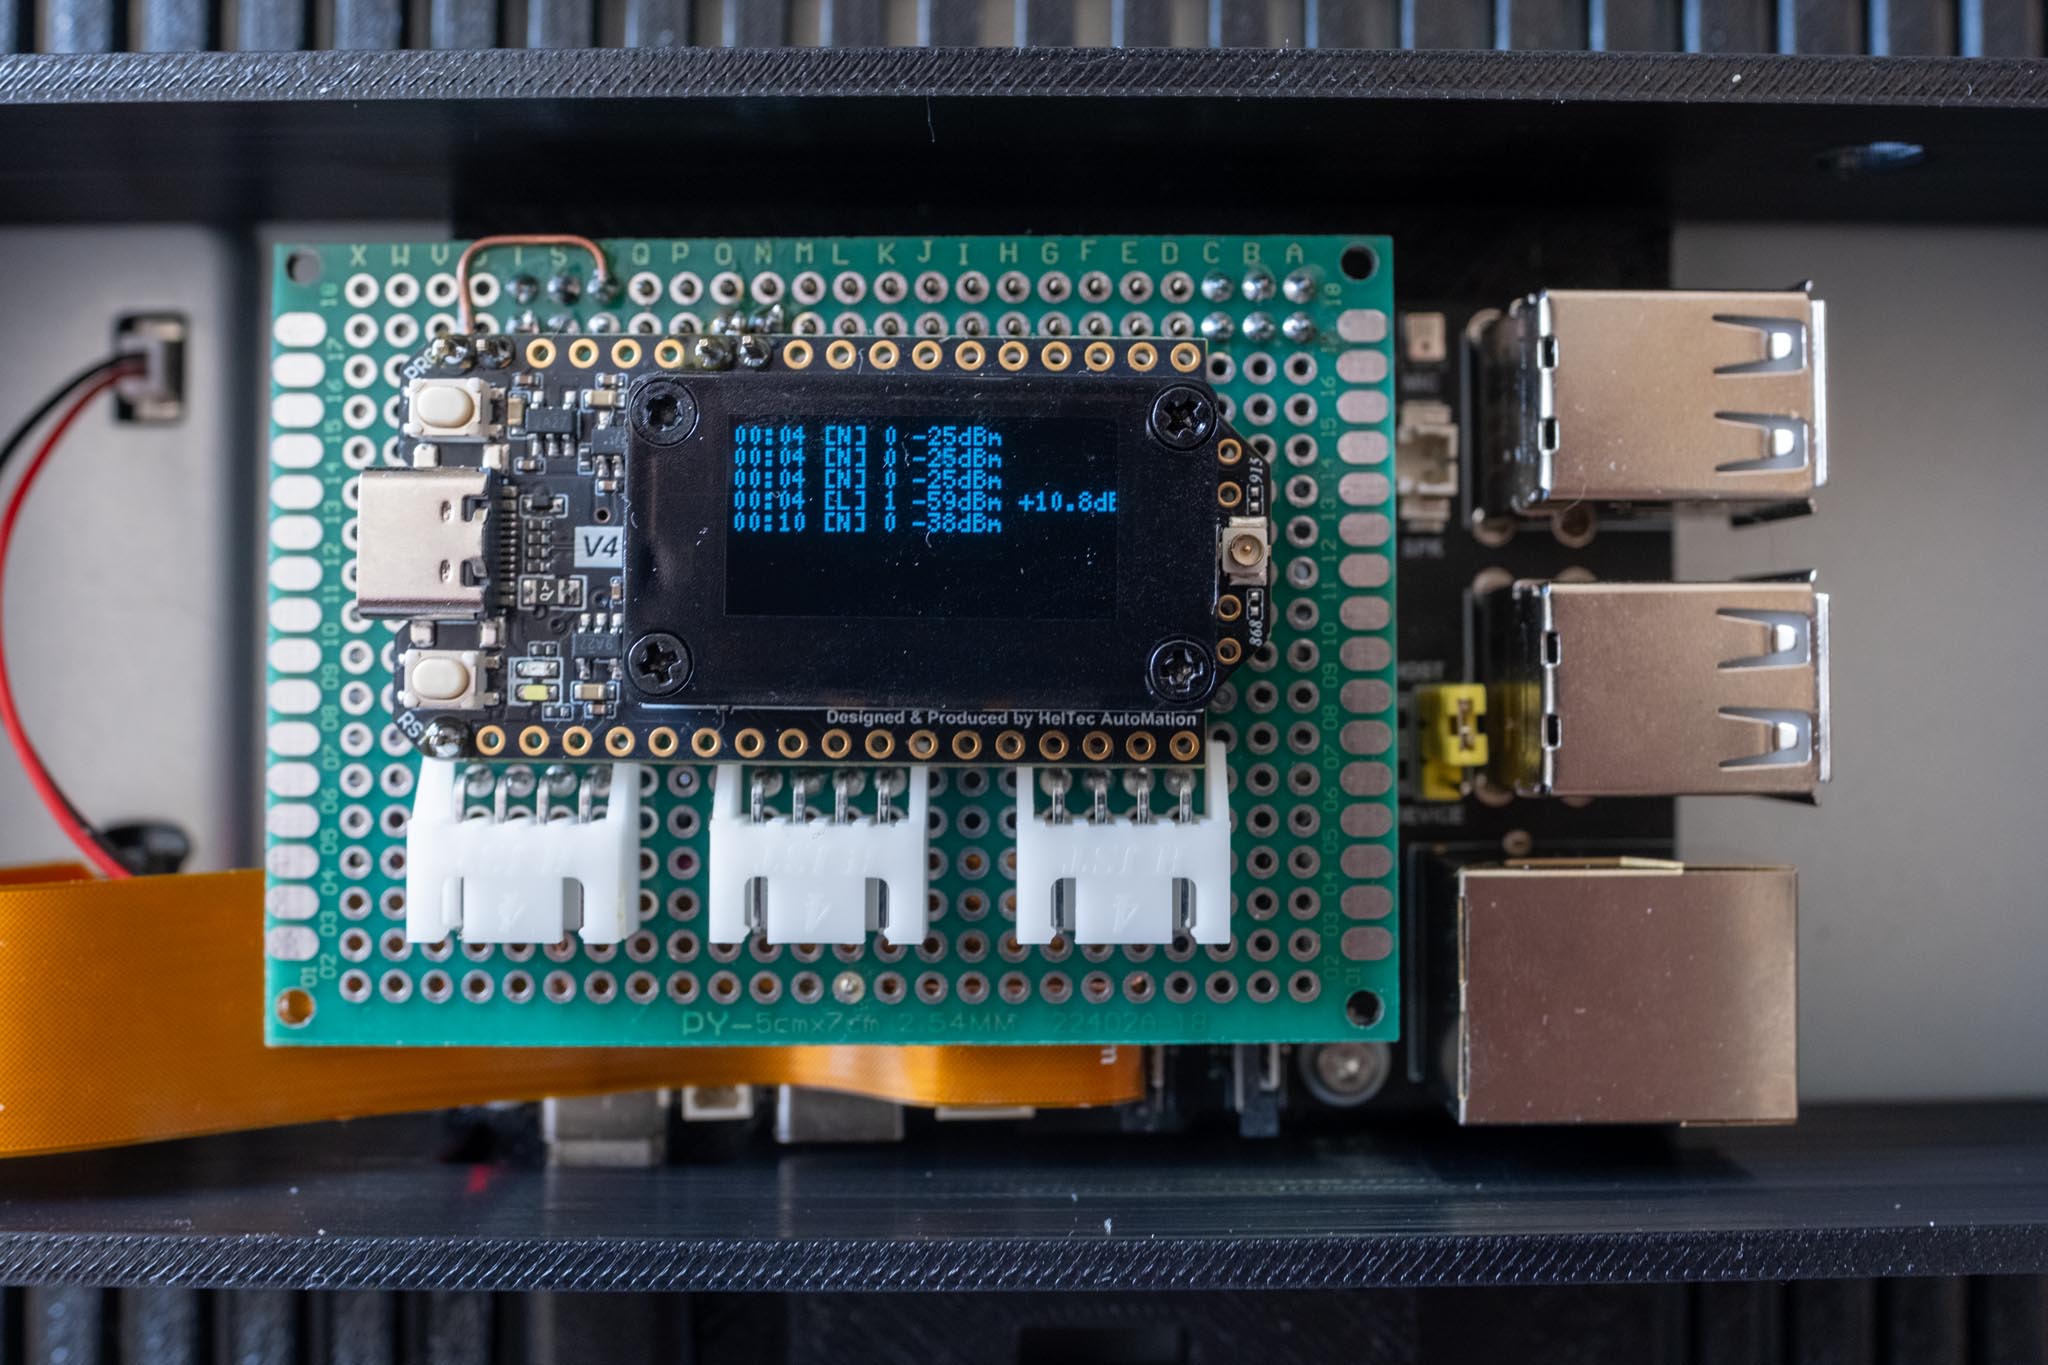
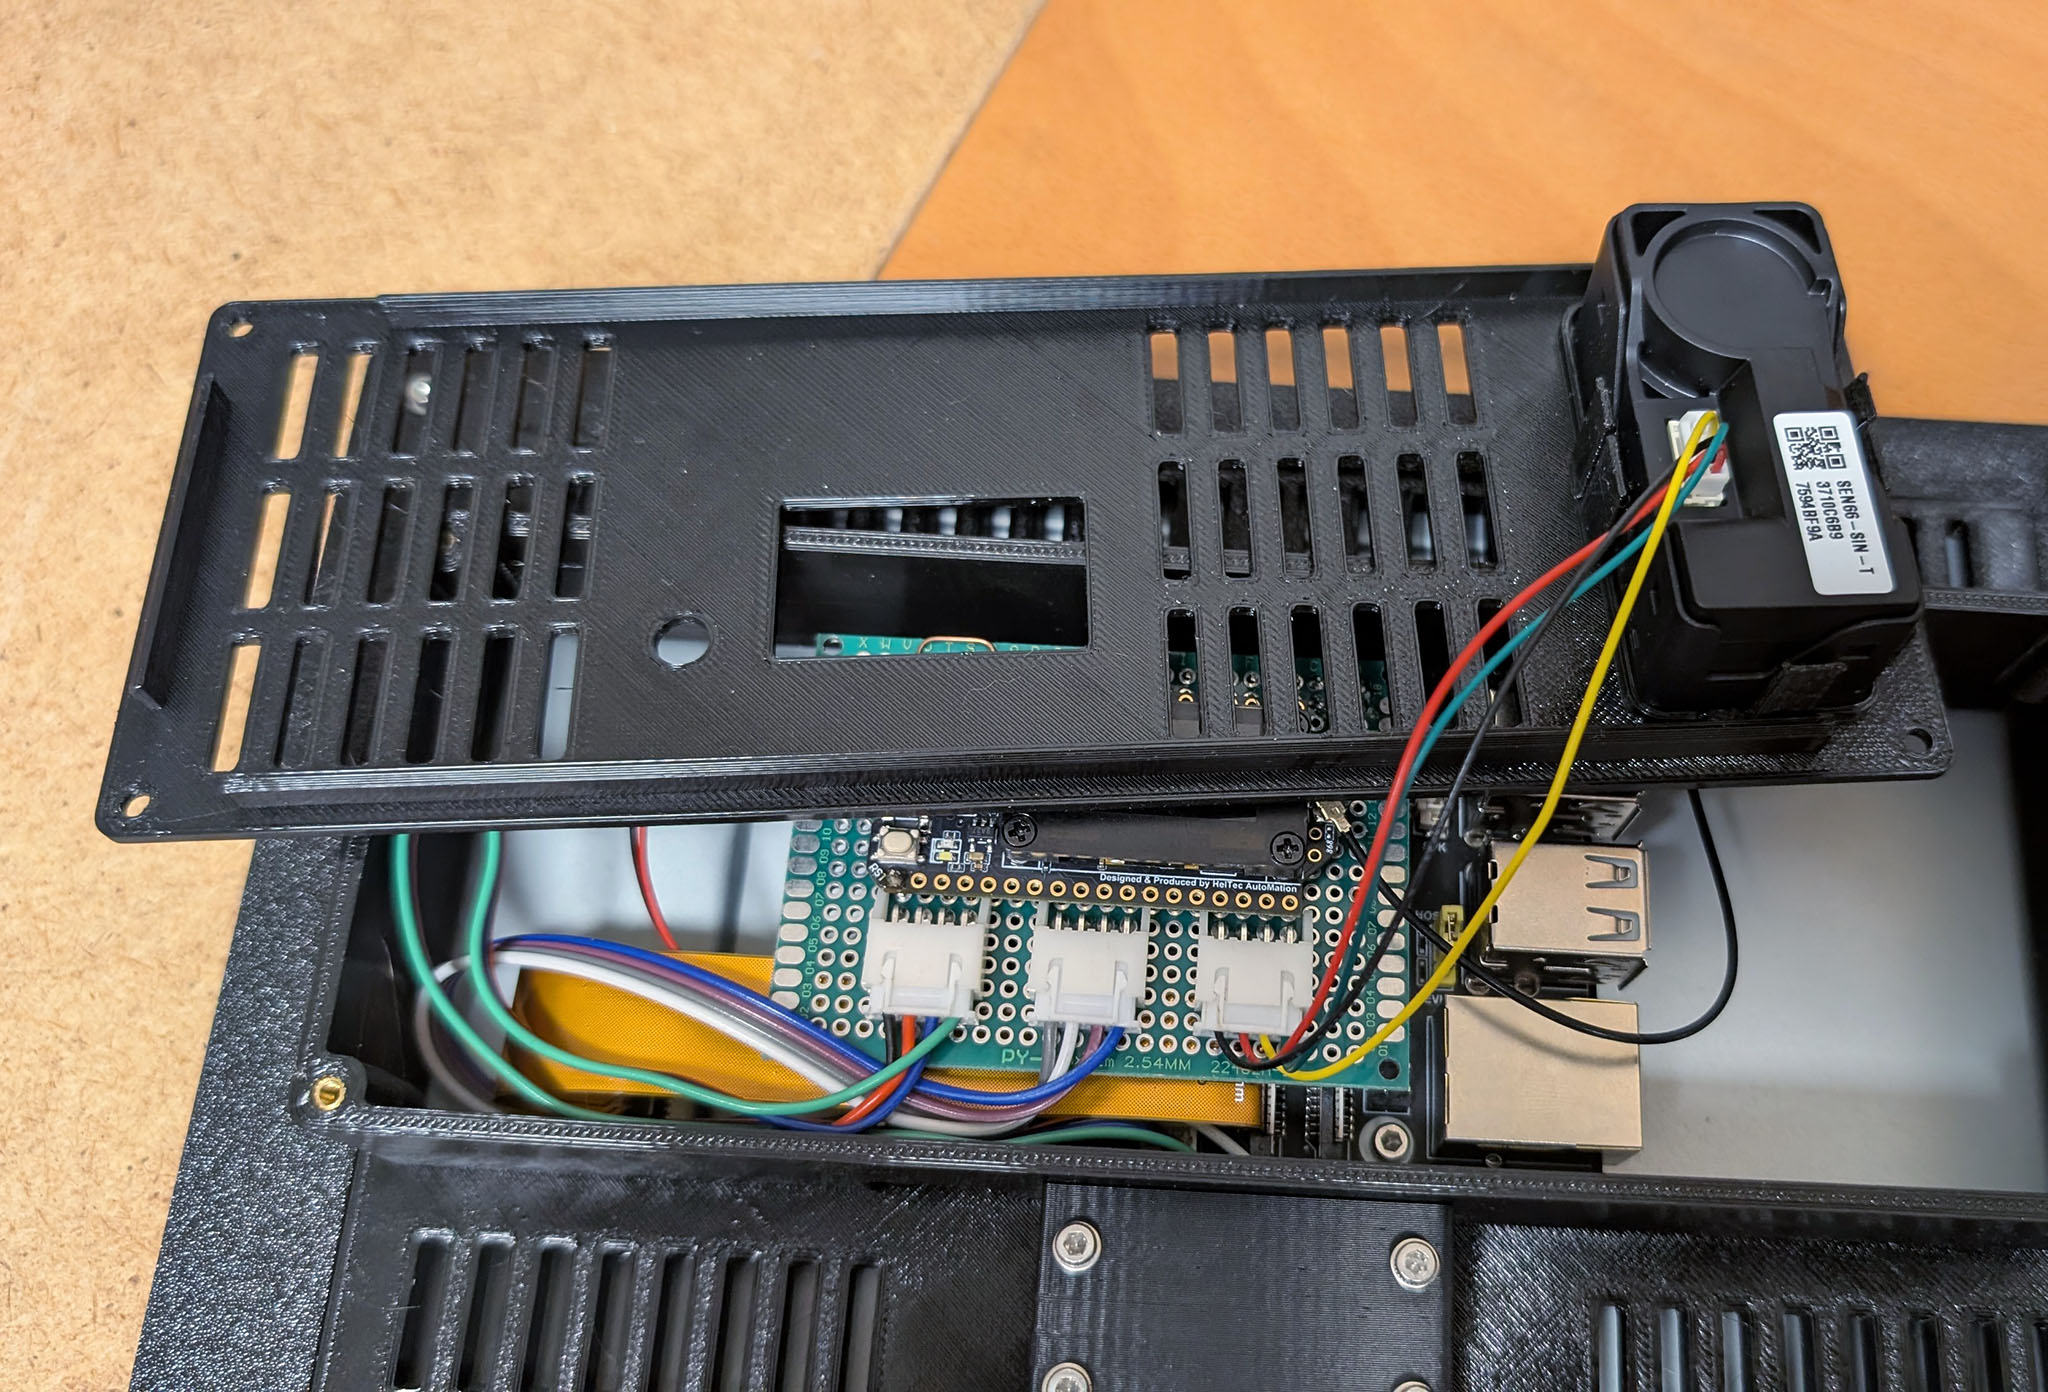
Assembled, the enclosure then looks like this.
Radio modules
At the moment I use three different radio modules for the weather station. Primarily I am interested in temperature and humidity. The sensor on the balcony also measures the air pressure, but this value is as a rule identical to the current value of the weather API. The Geiger counter is pure gimmickry, but somehow also amusing.
ESP-NOW sensor with BME280
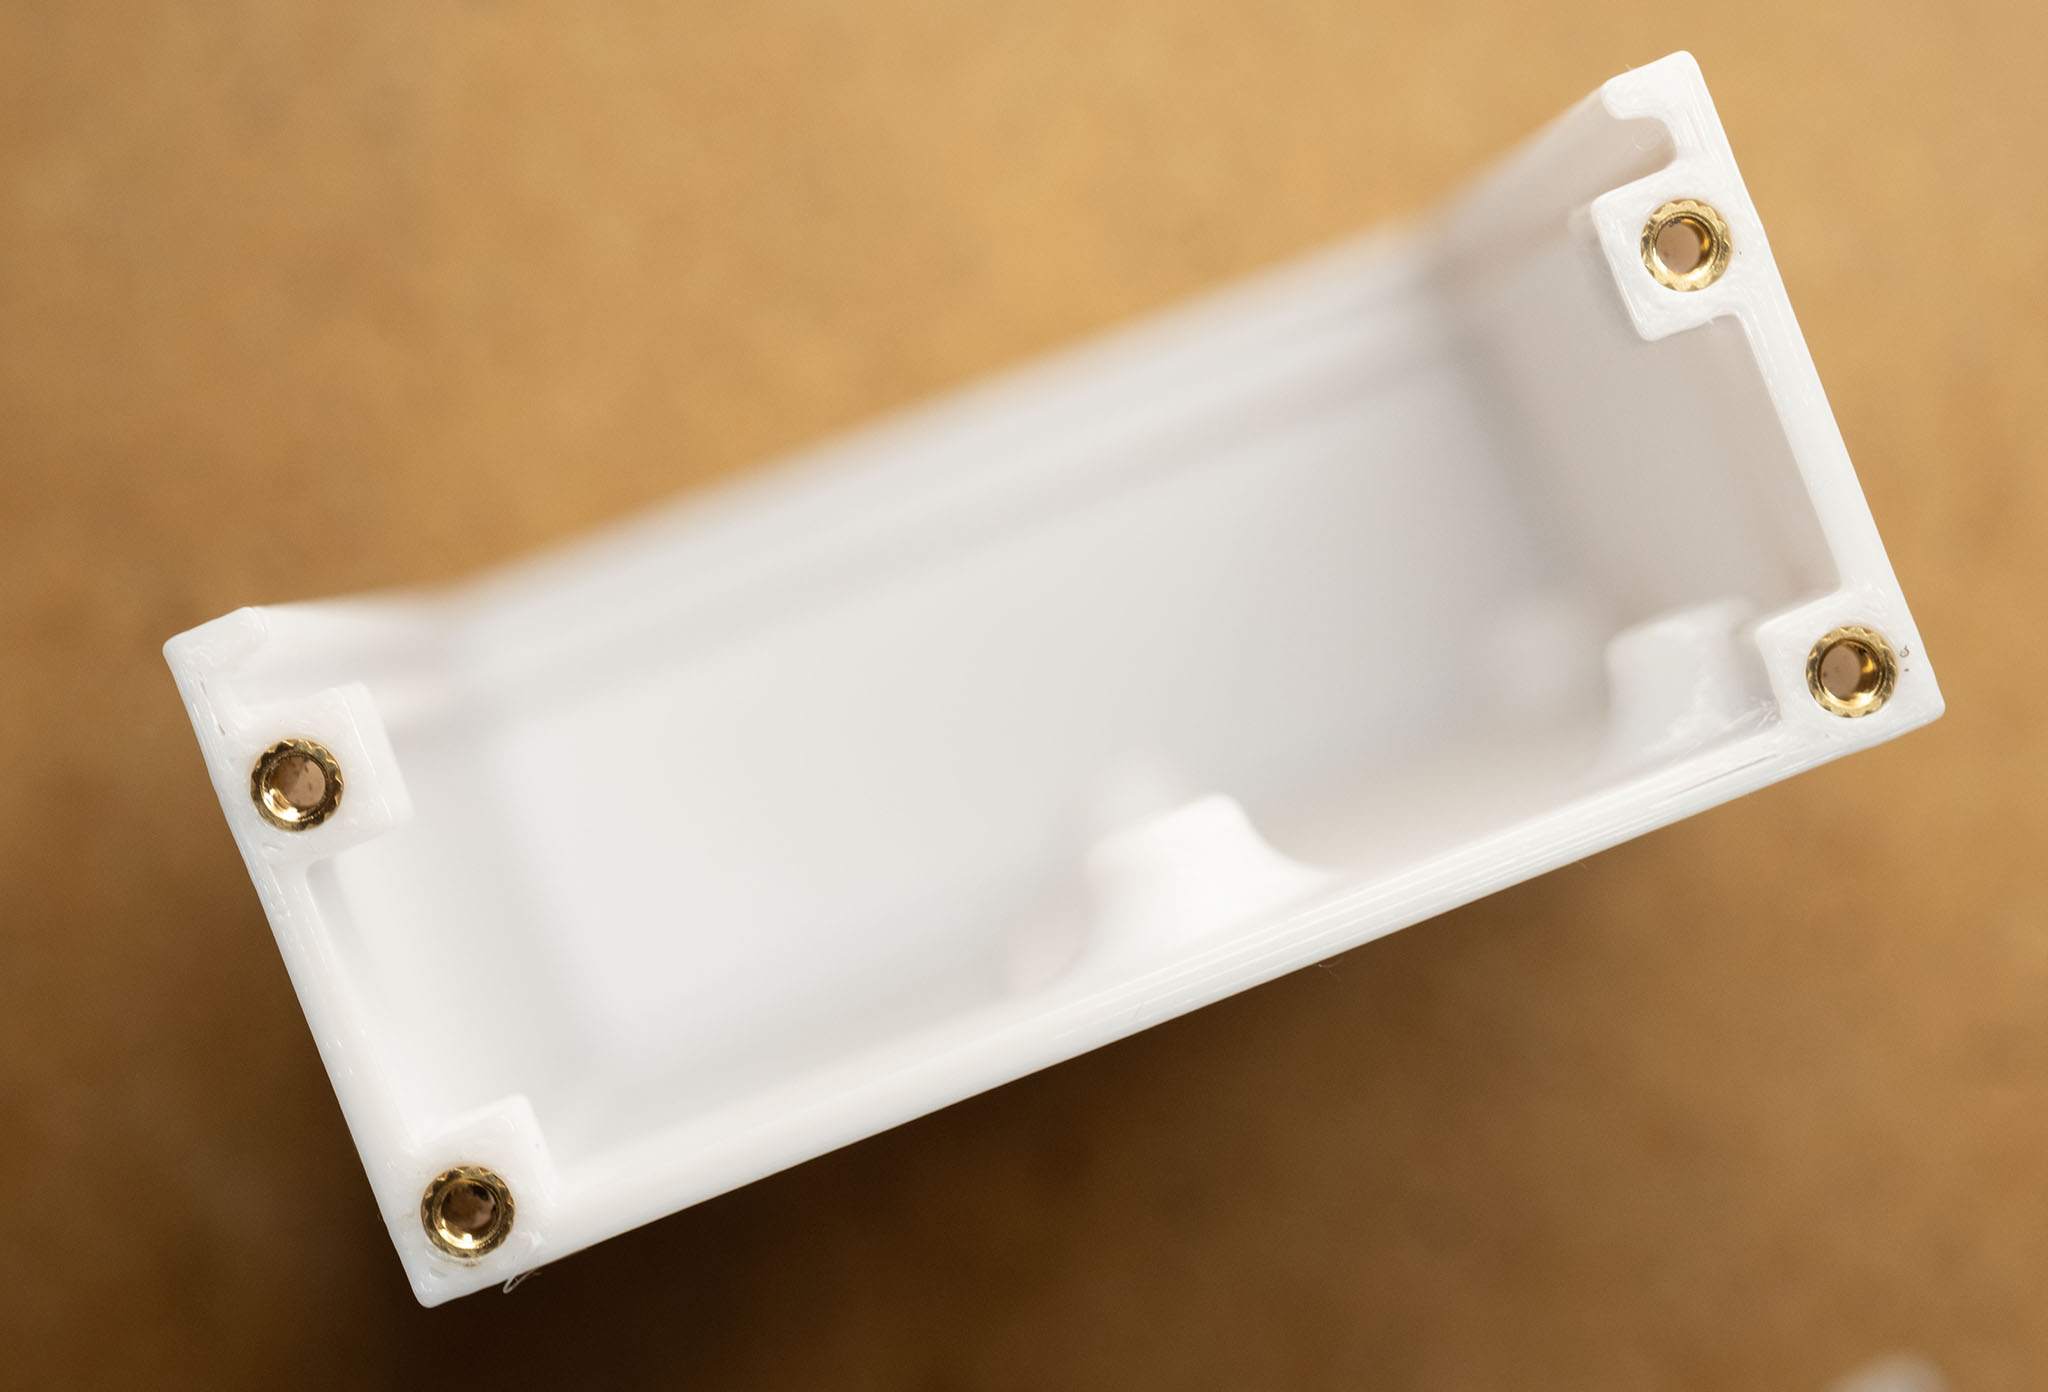
I already used this sensor in my first ESP32 weather station. The board is self-designed and based on an ESP32 with a Bosch BME280 as the sensor. The battery can be charged via solar cells. The enclosure, however, is a new development and considerably more robust than the old version. There is a variant with one and two solar cells, as a result of which the battery practically never runs empty if the sensor stands near a window.
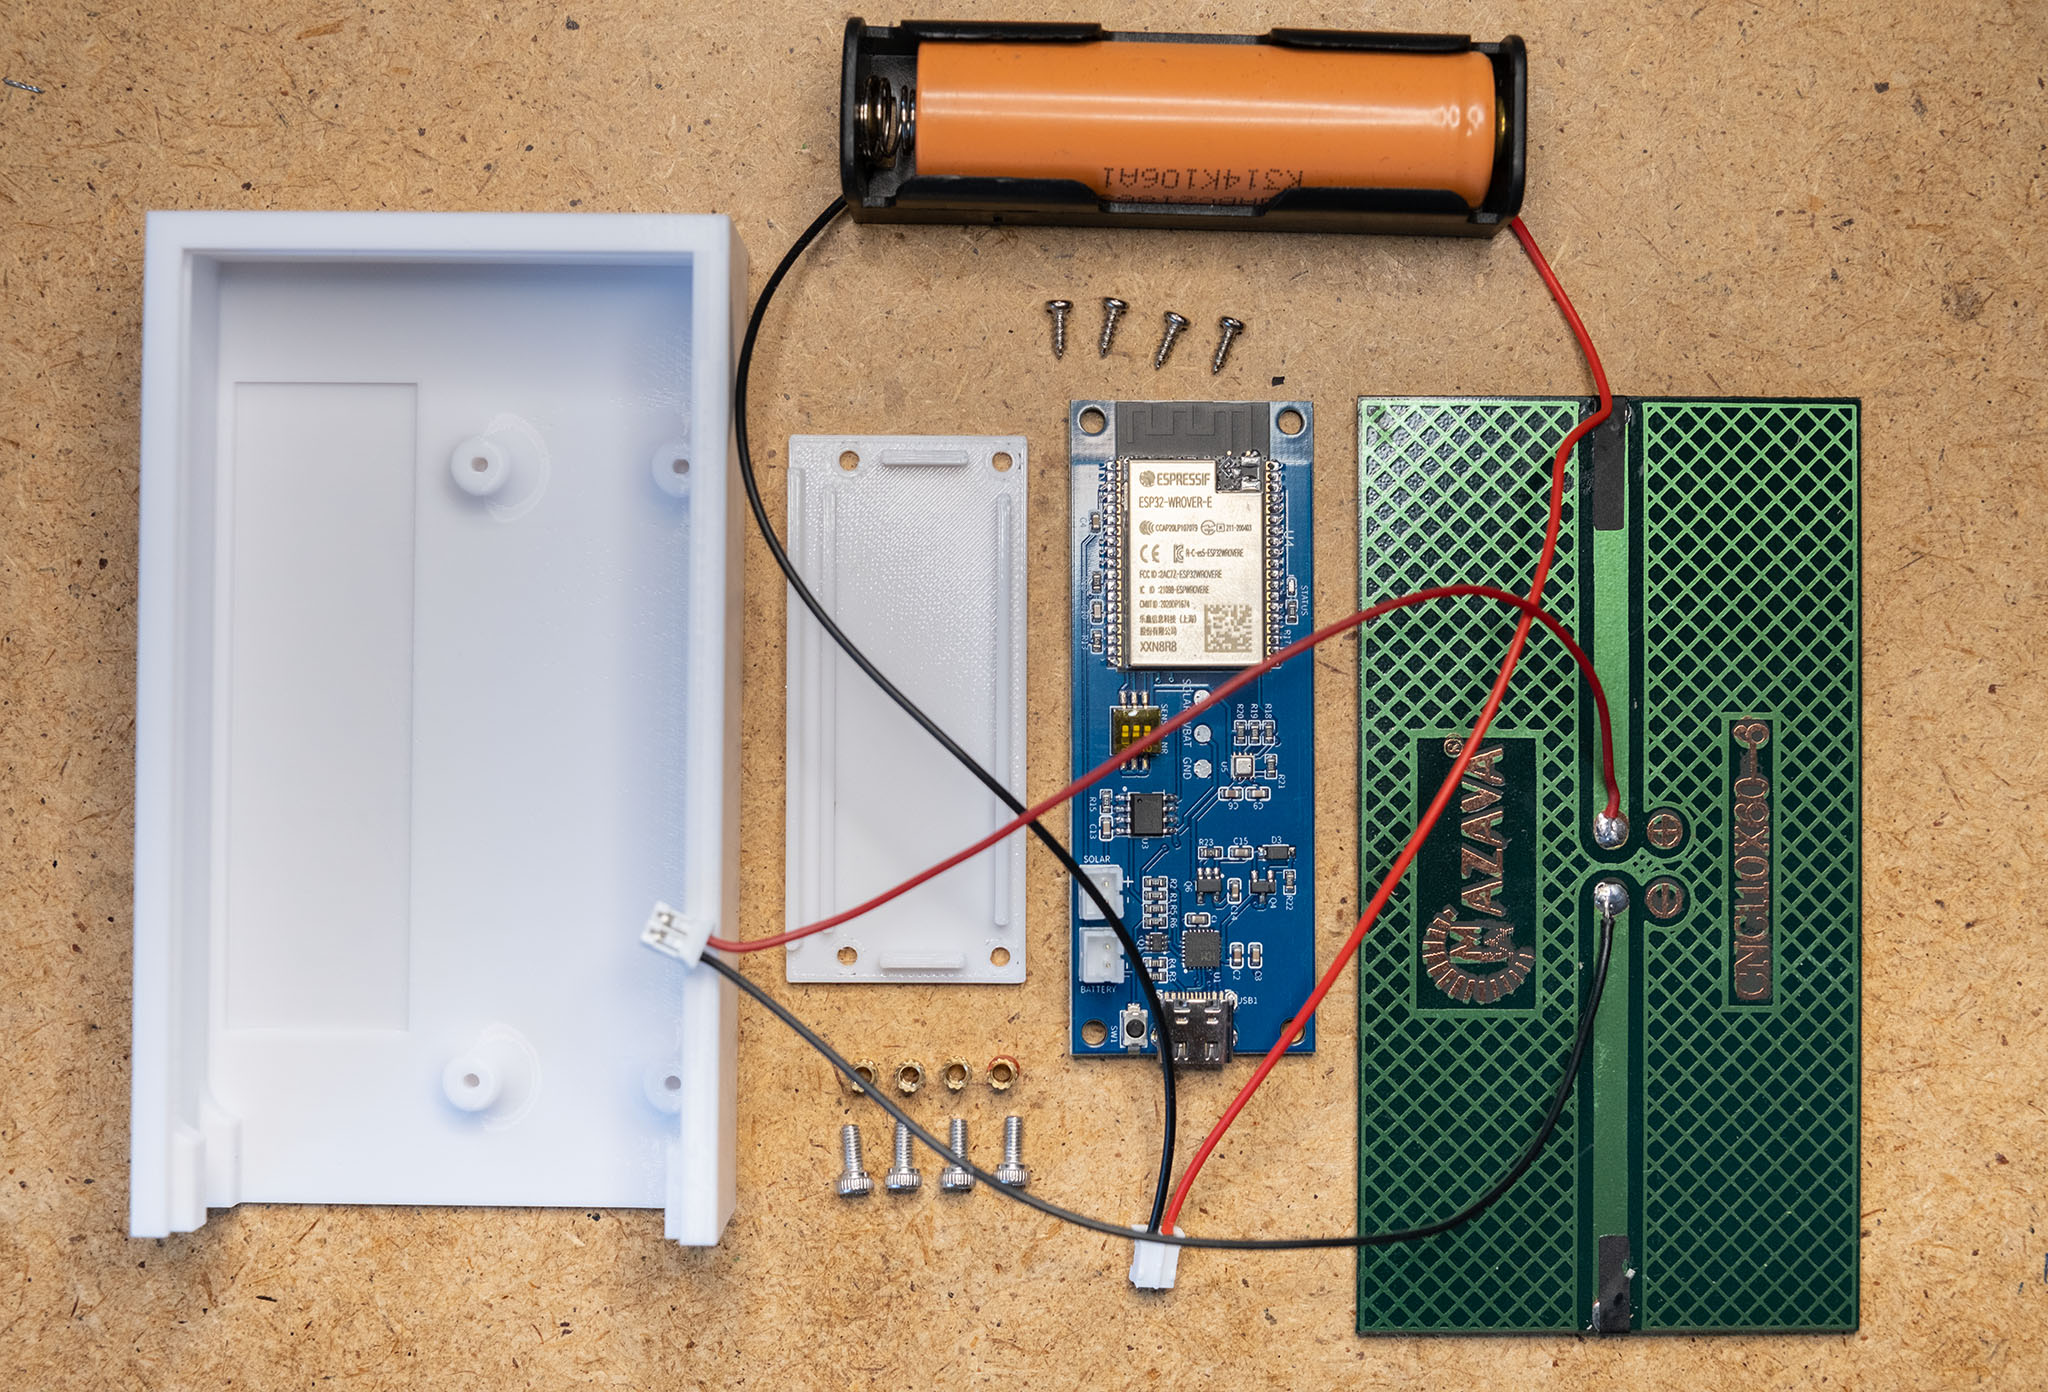
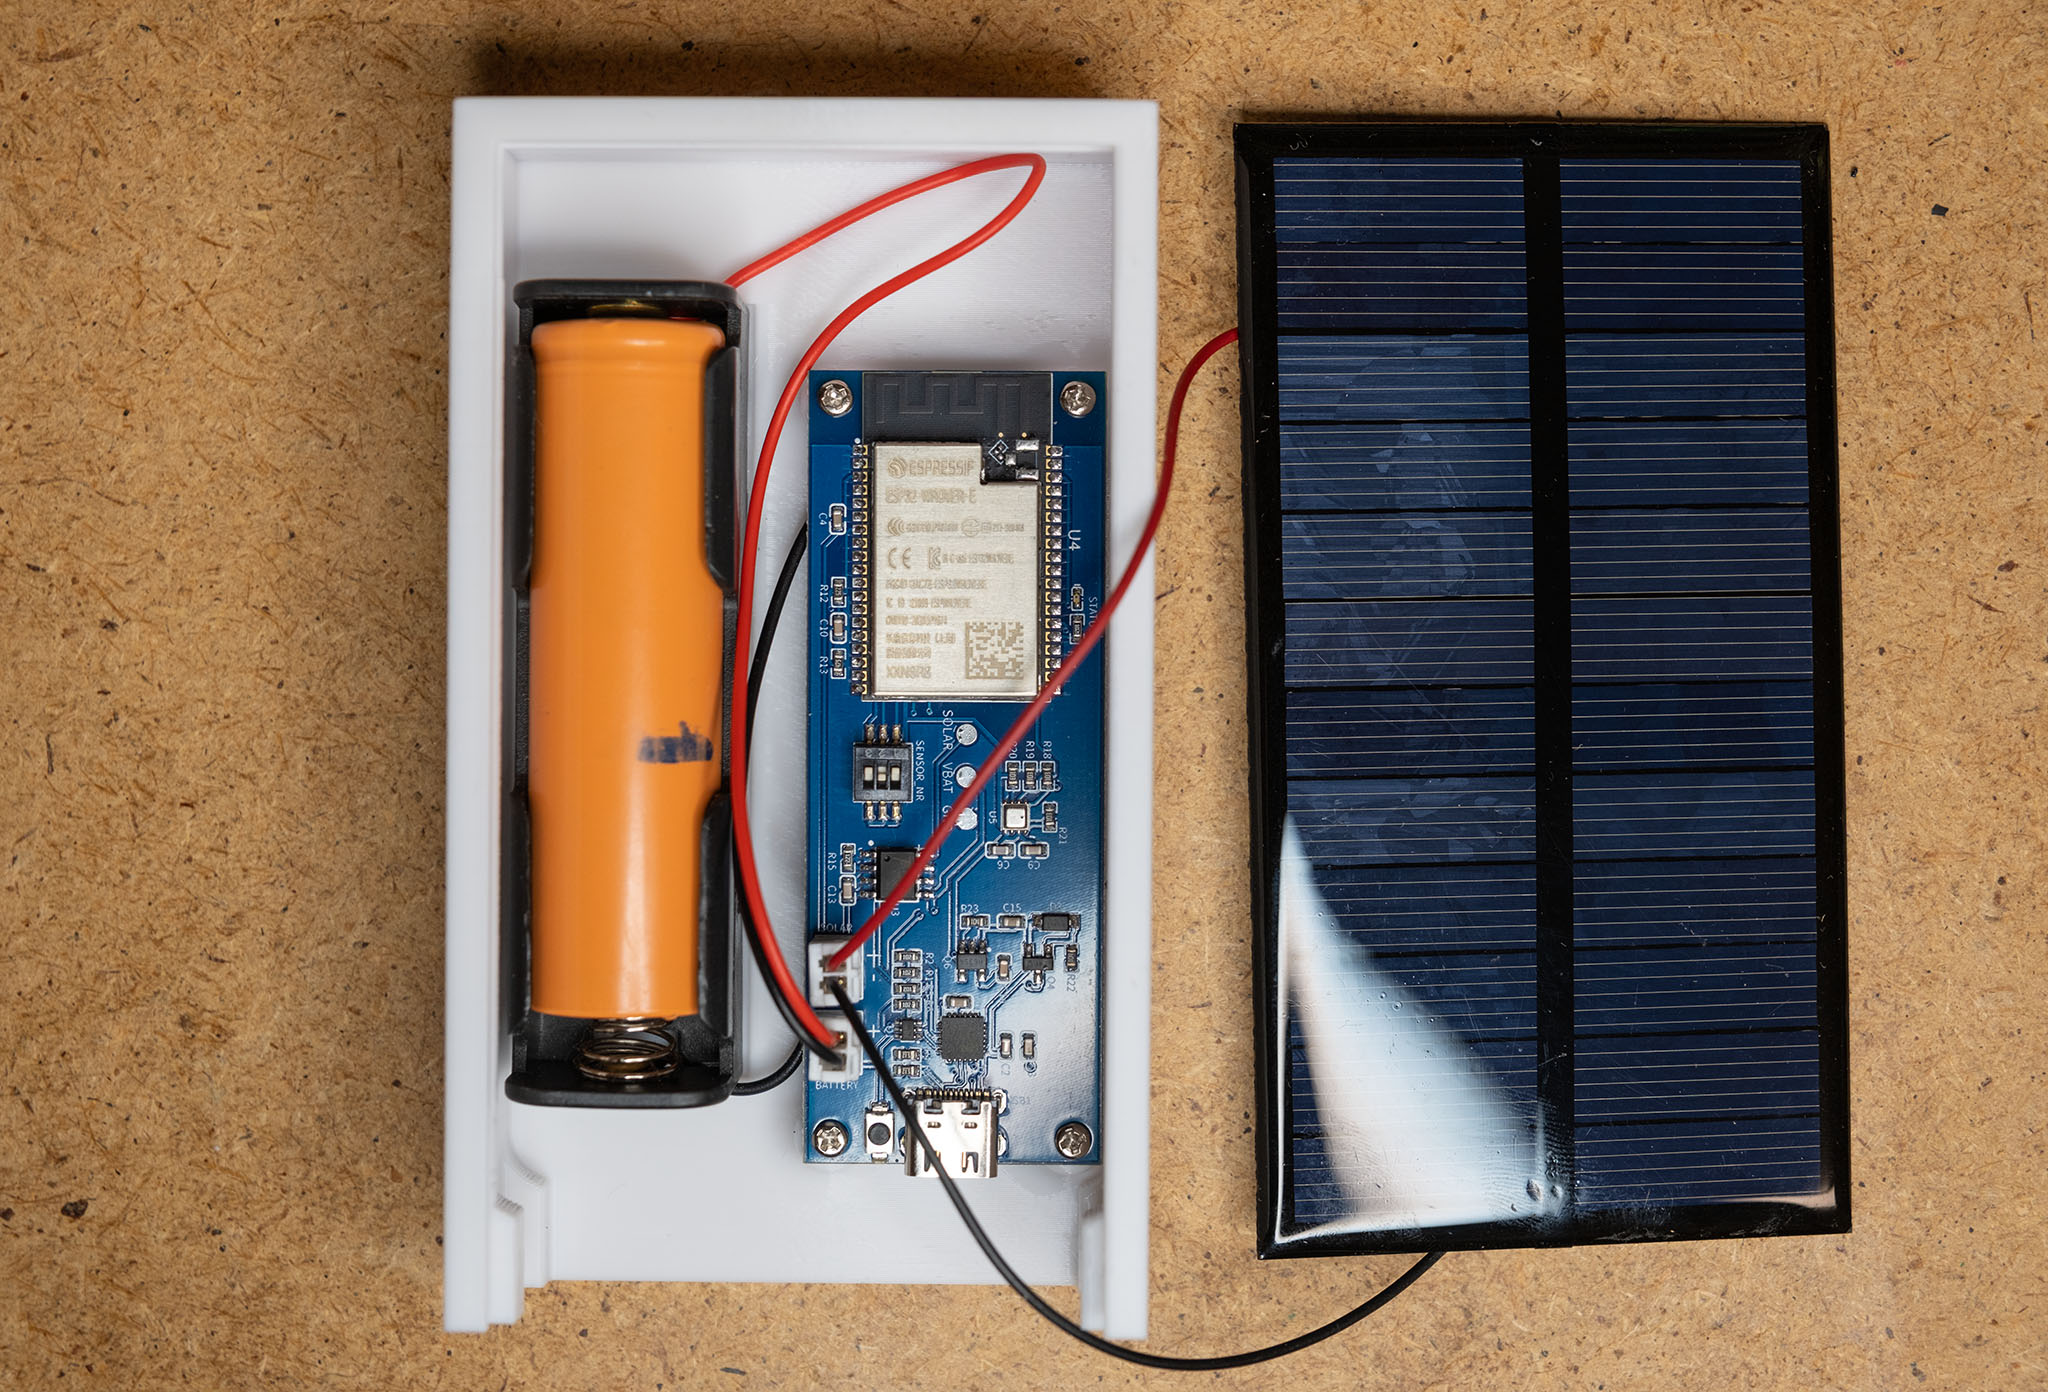
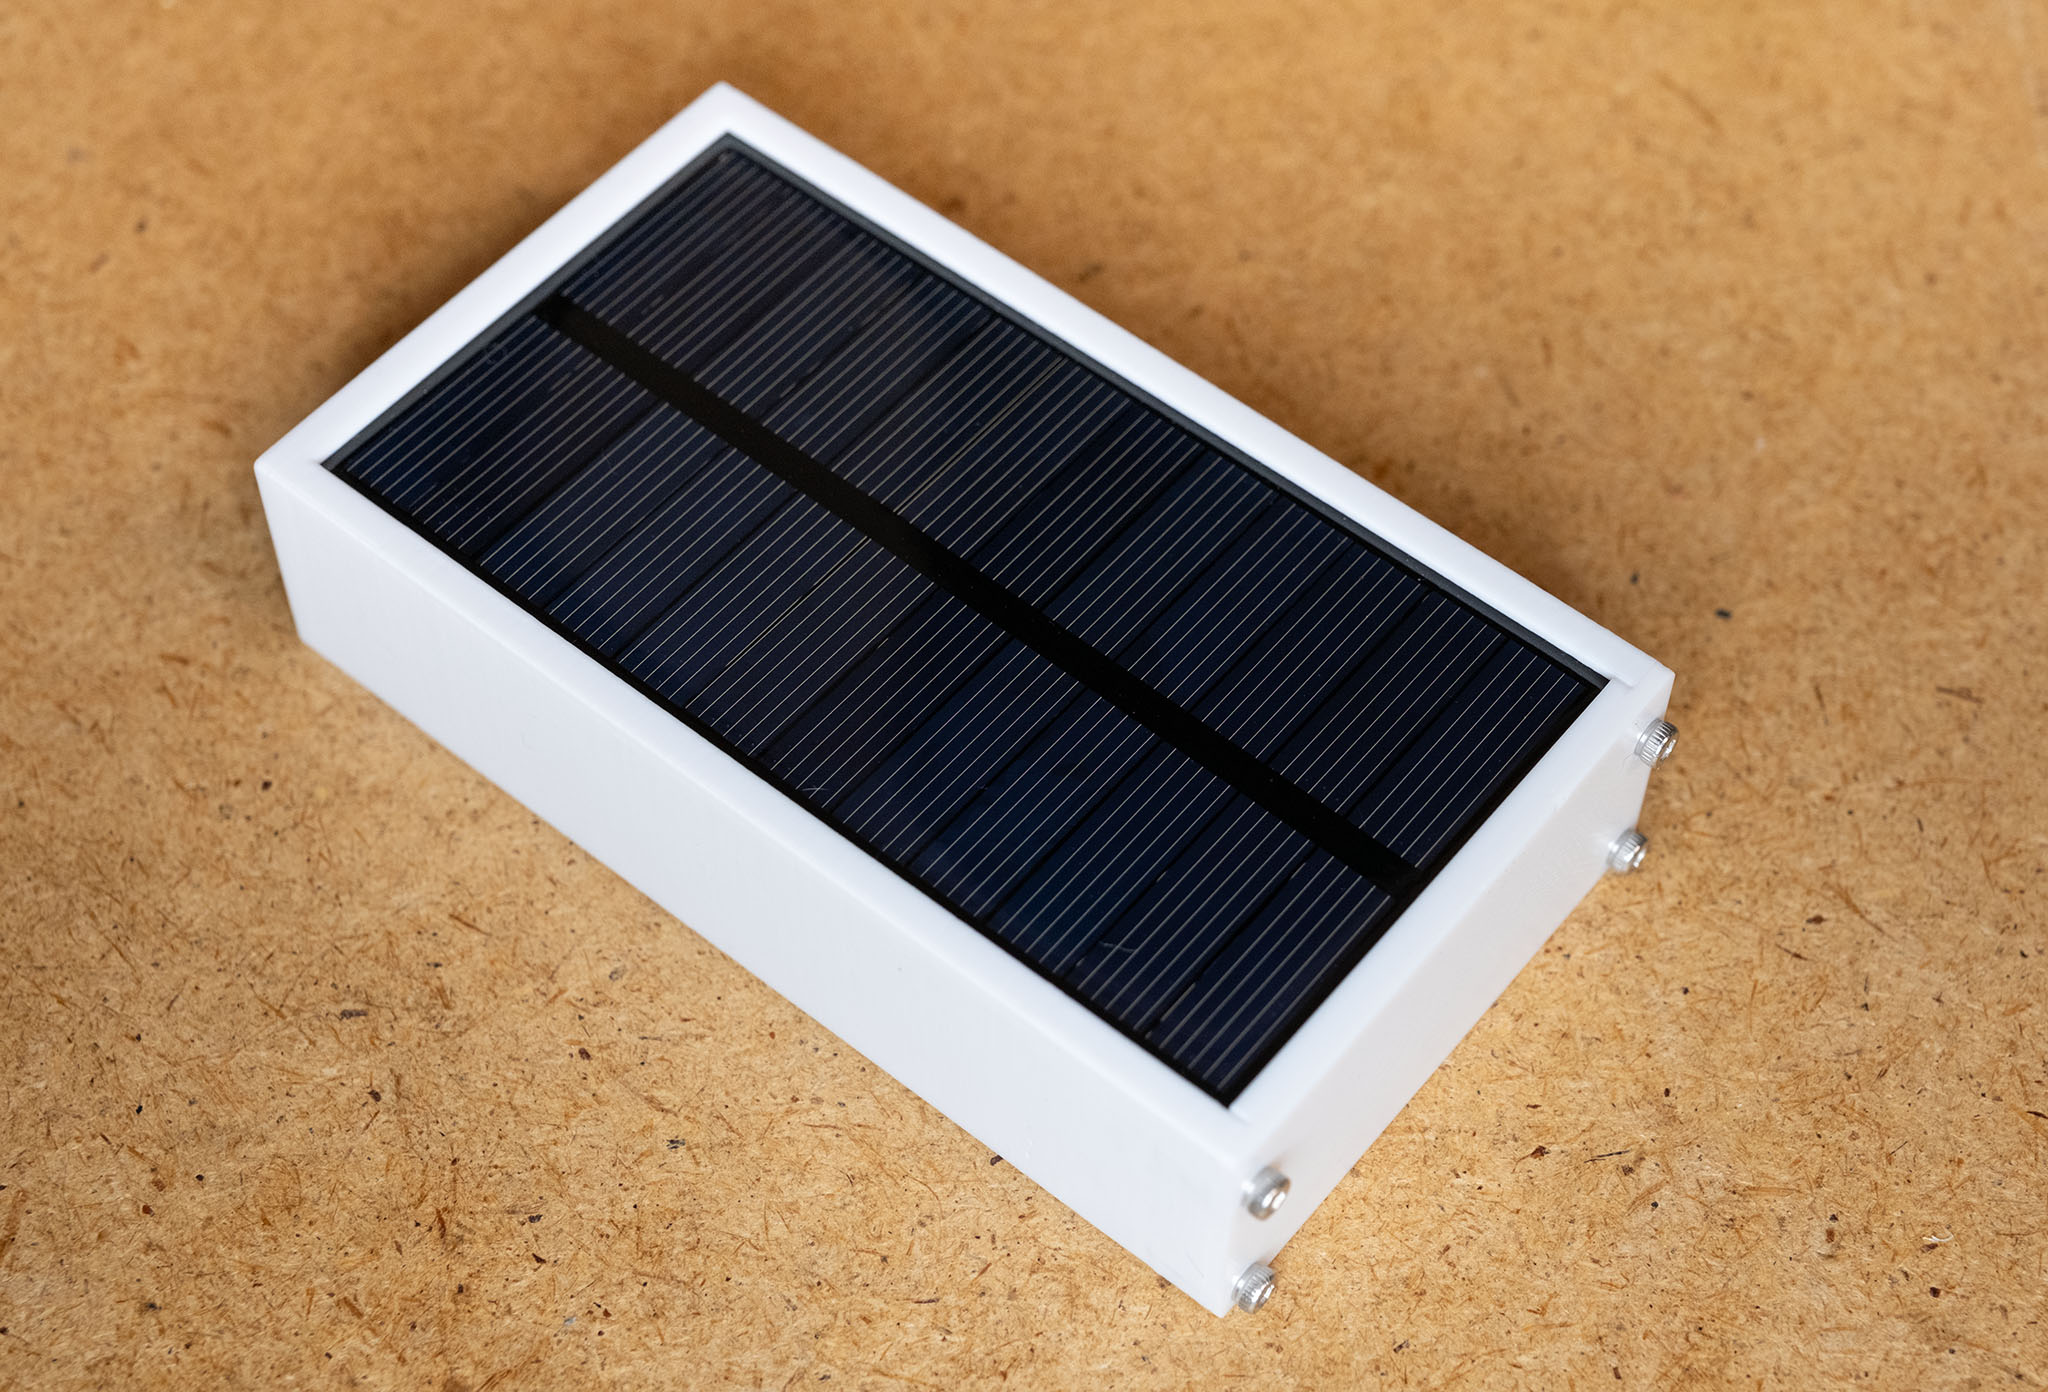
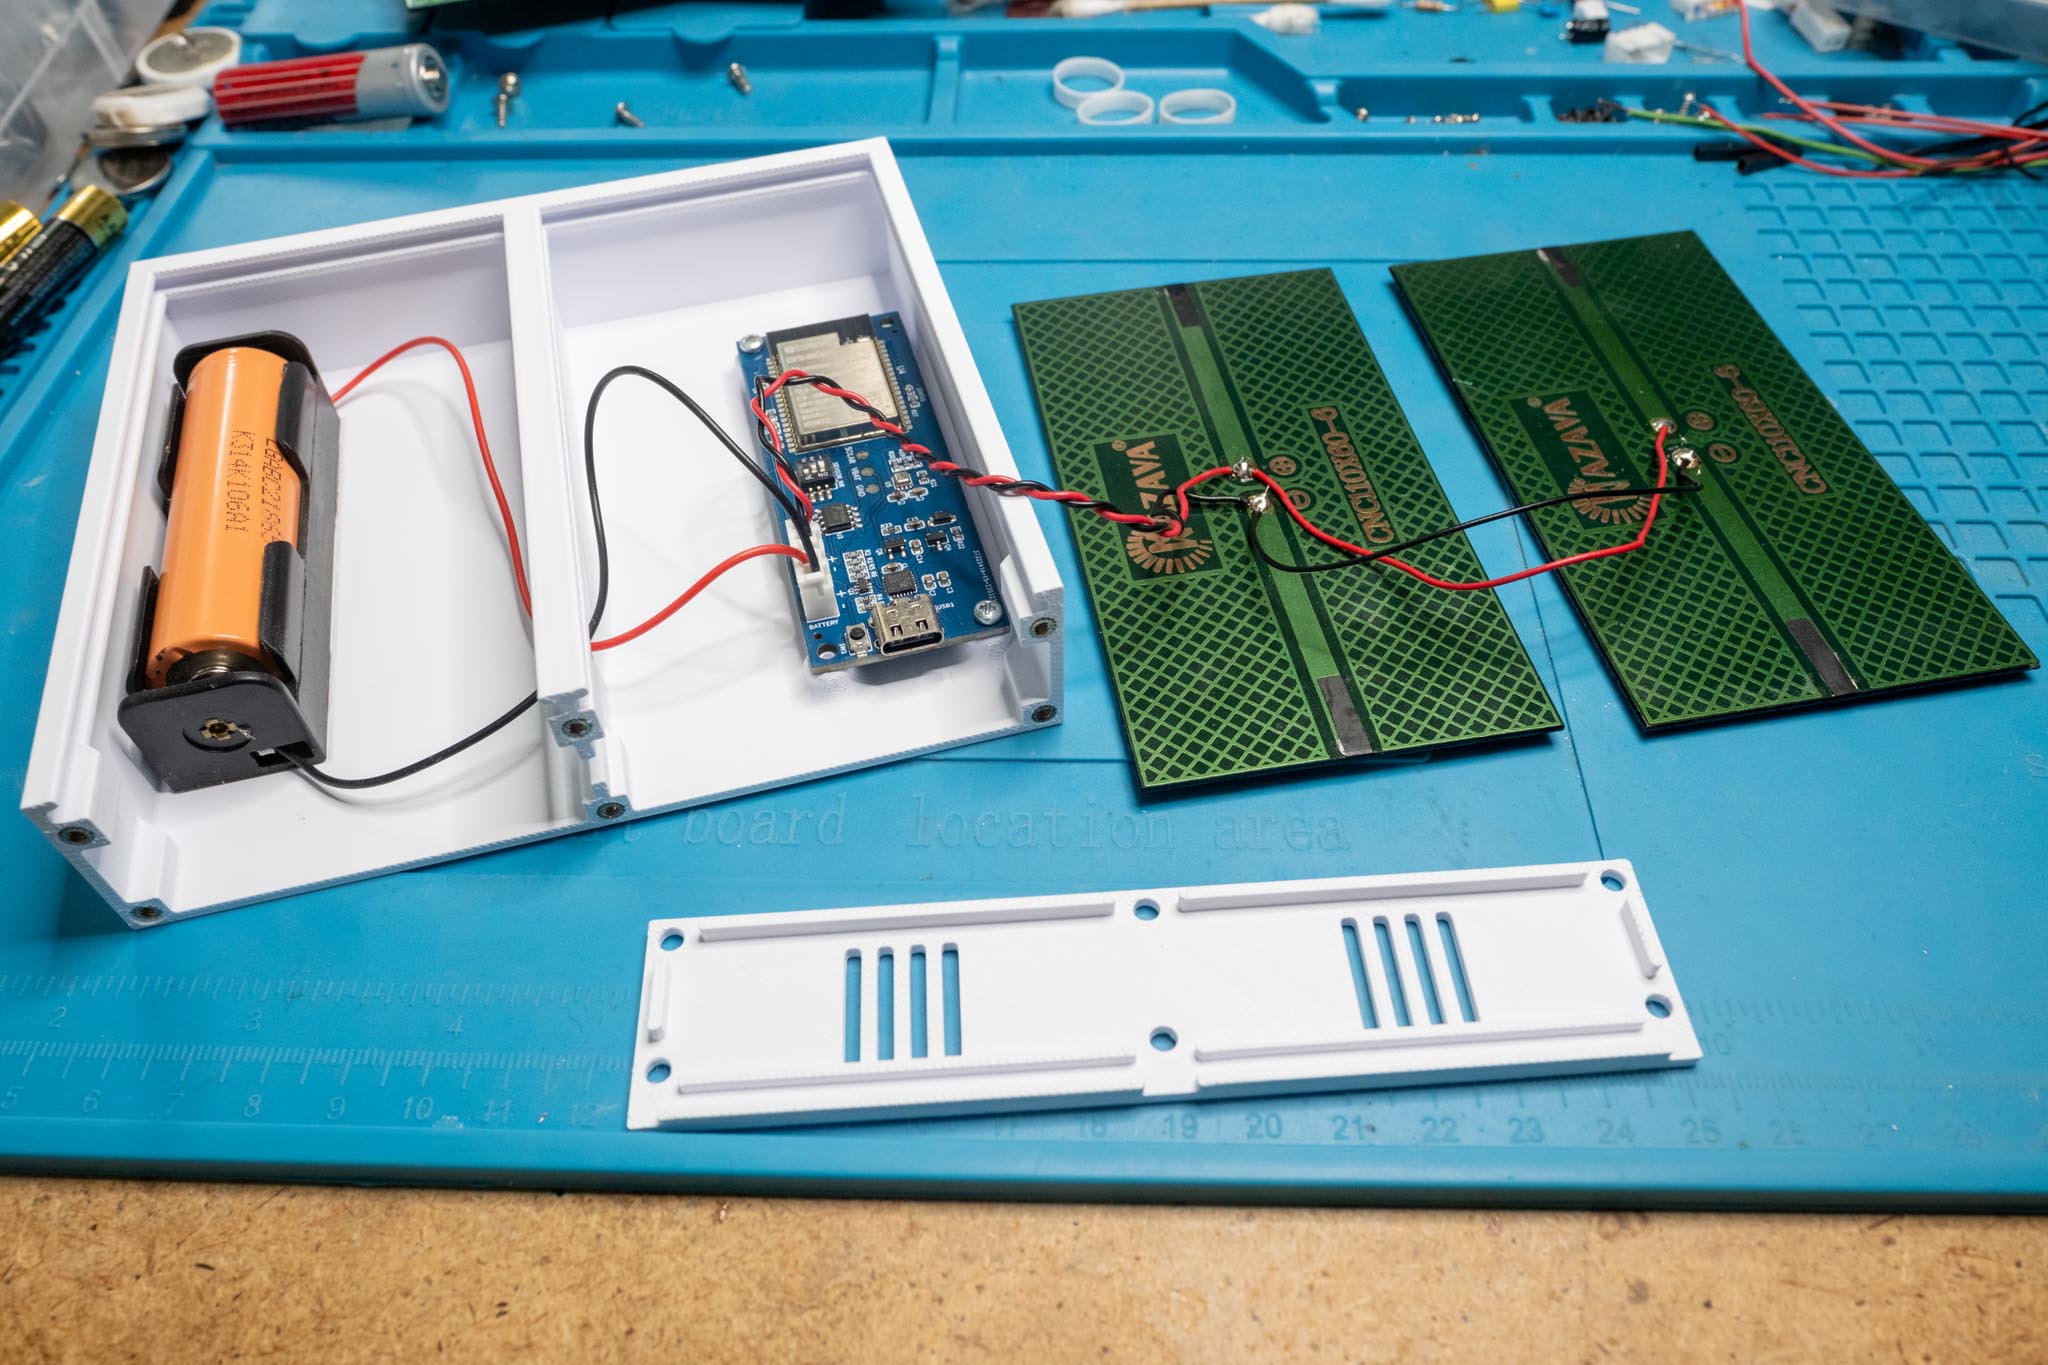
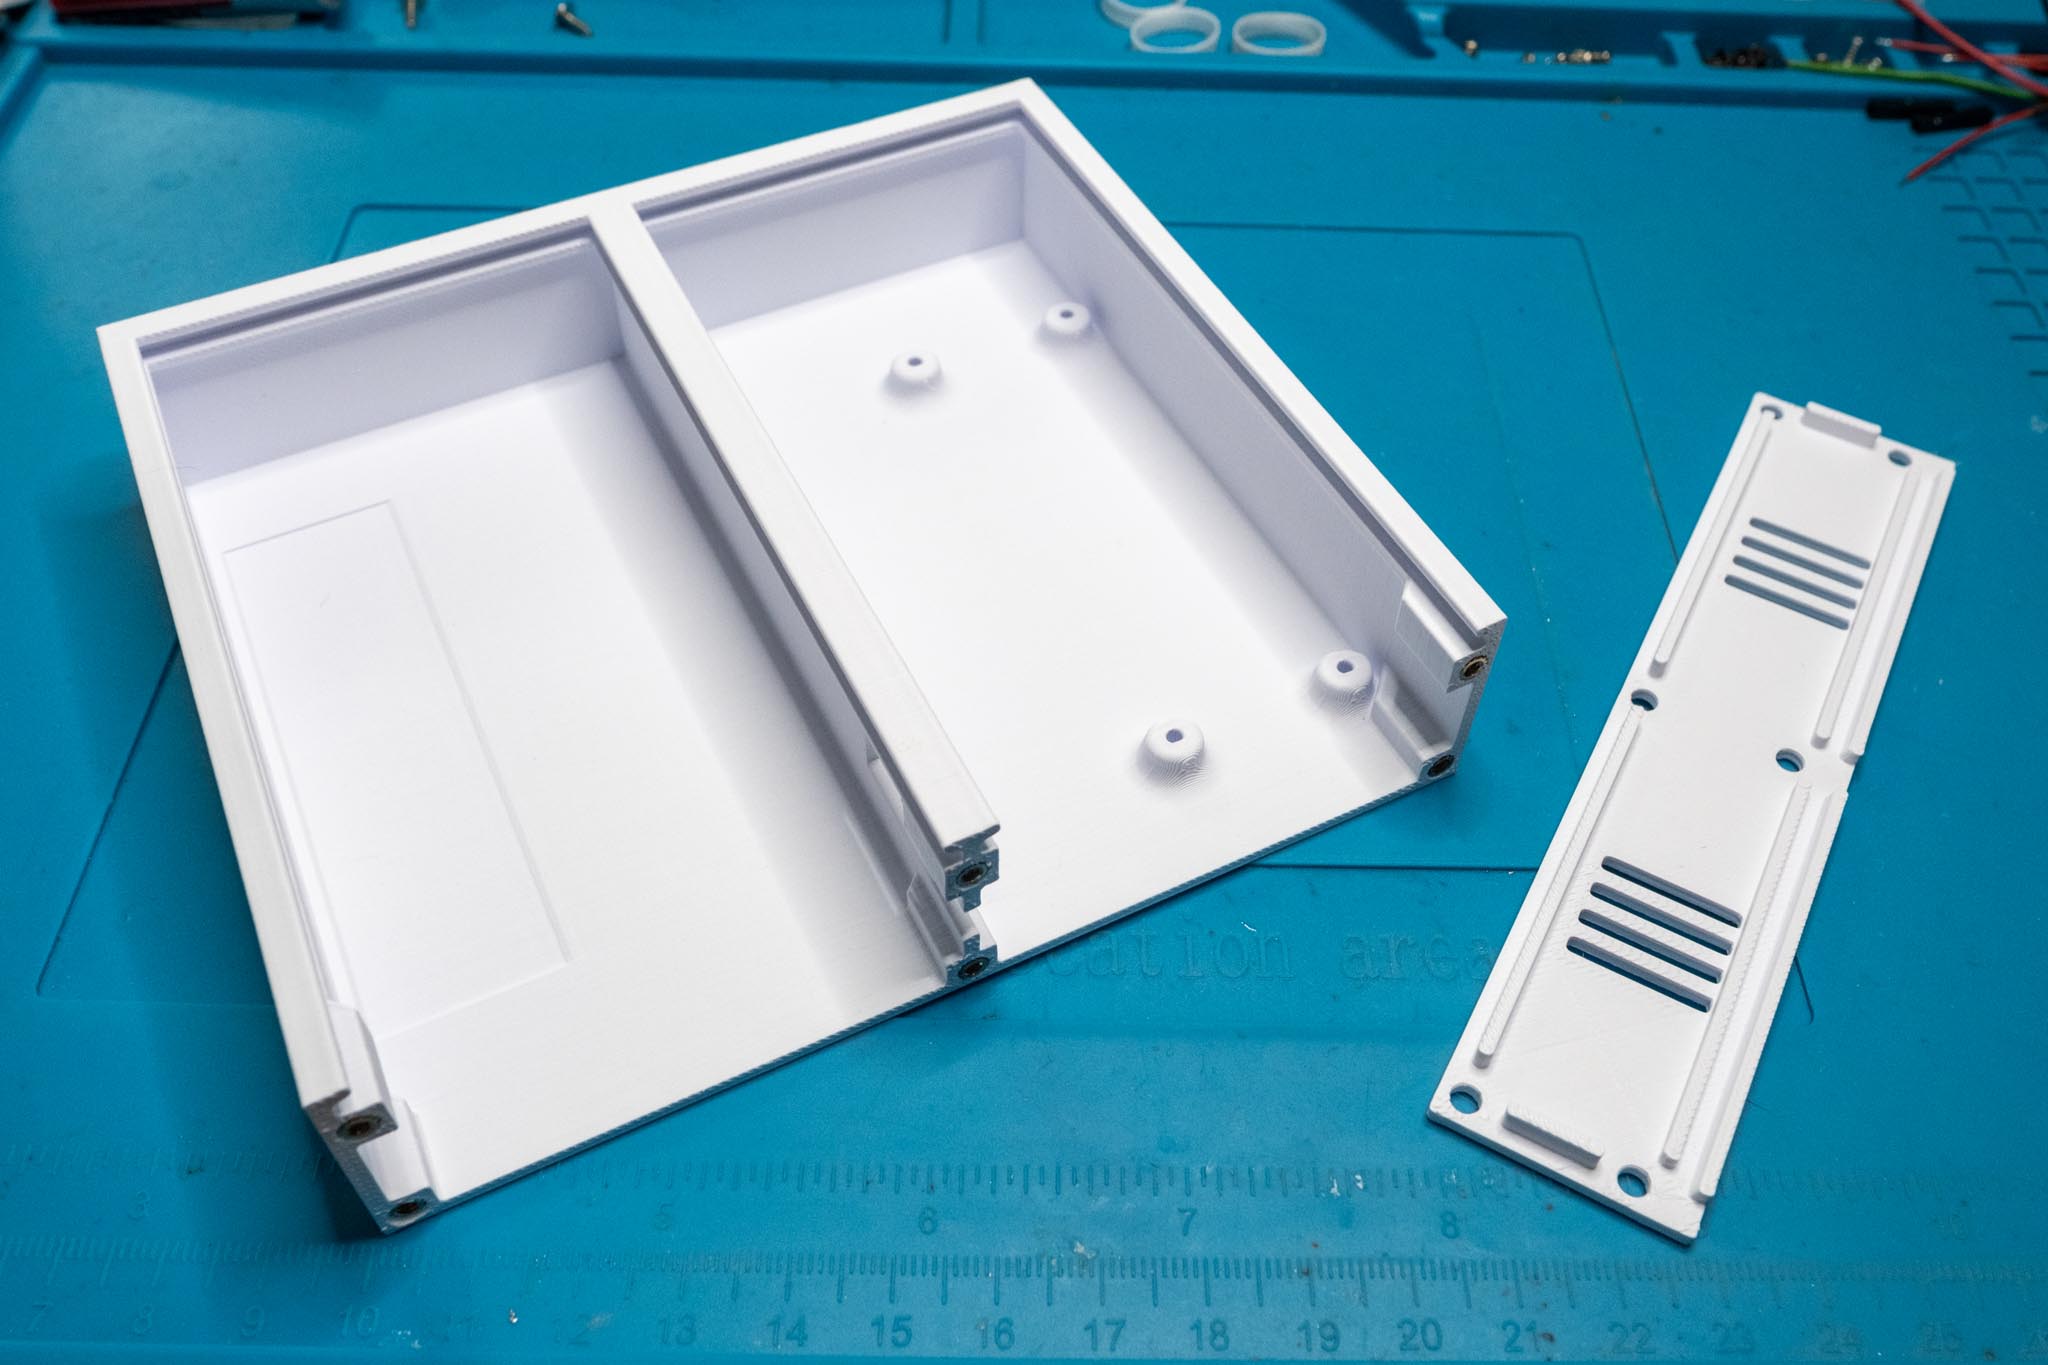
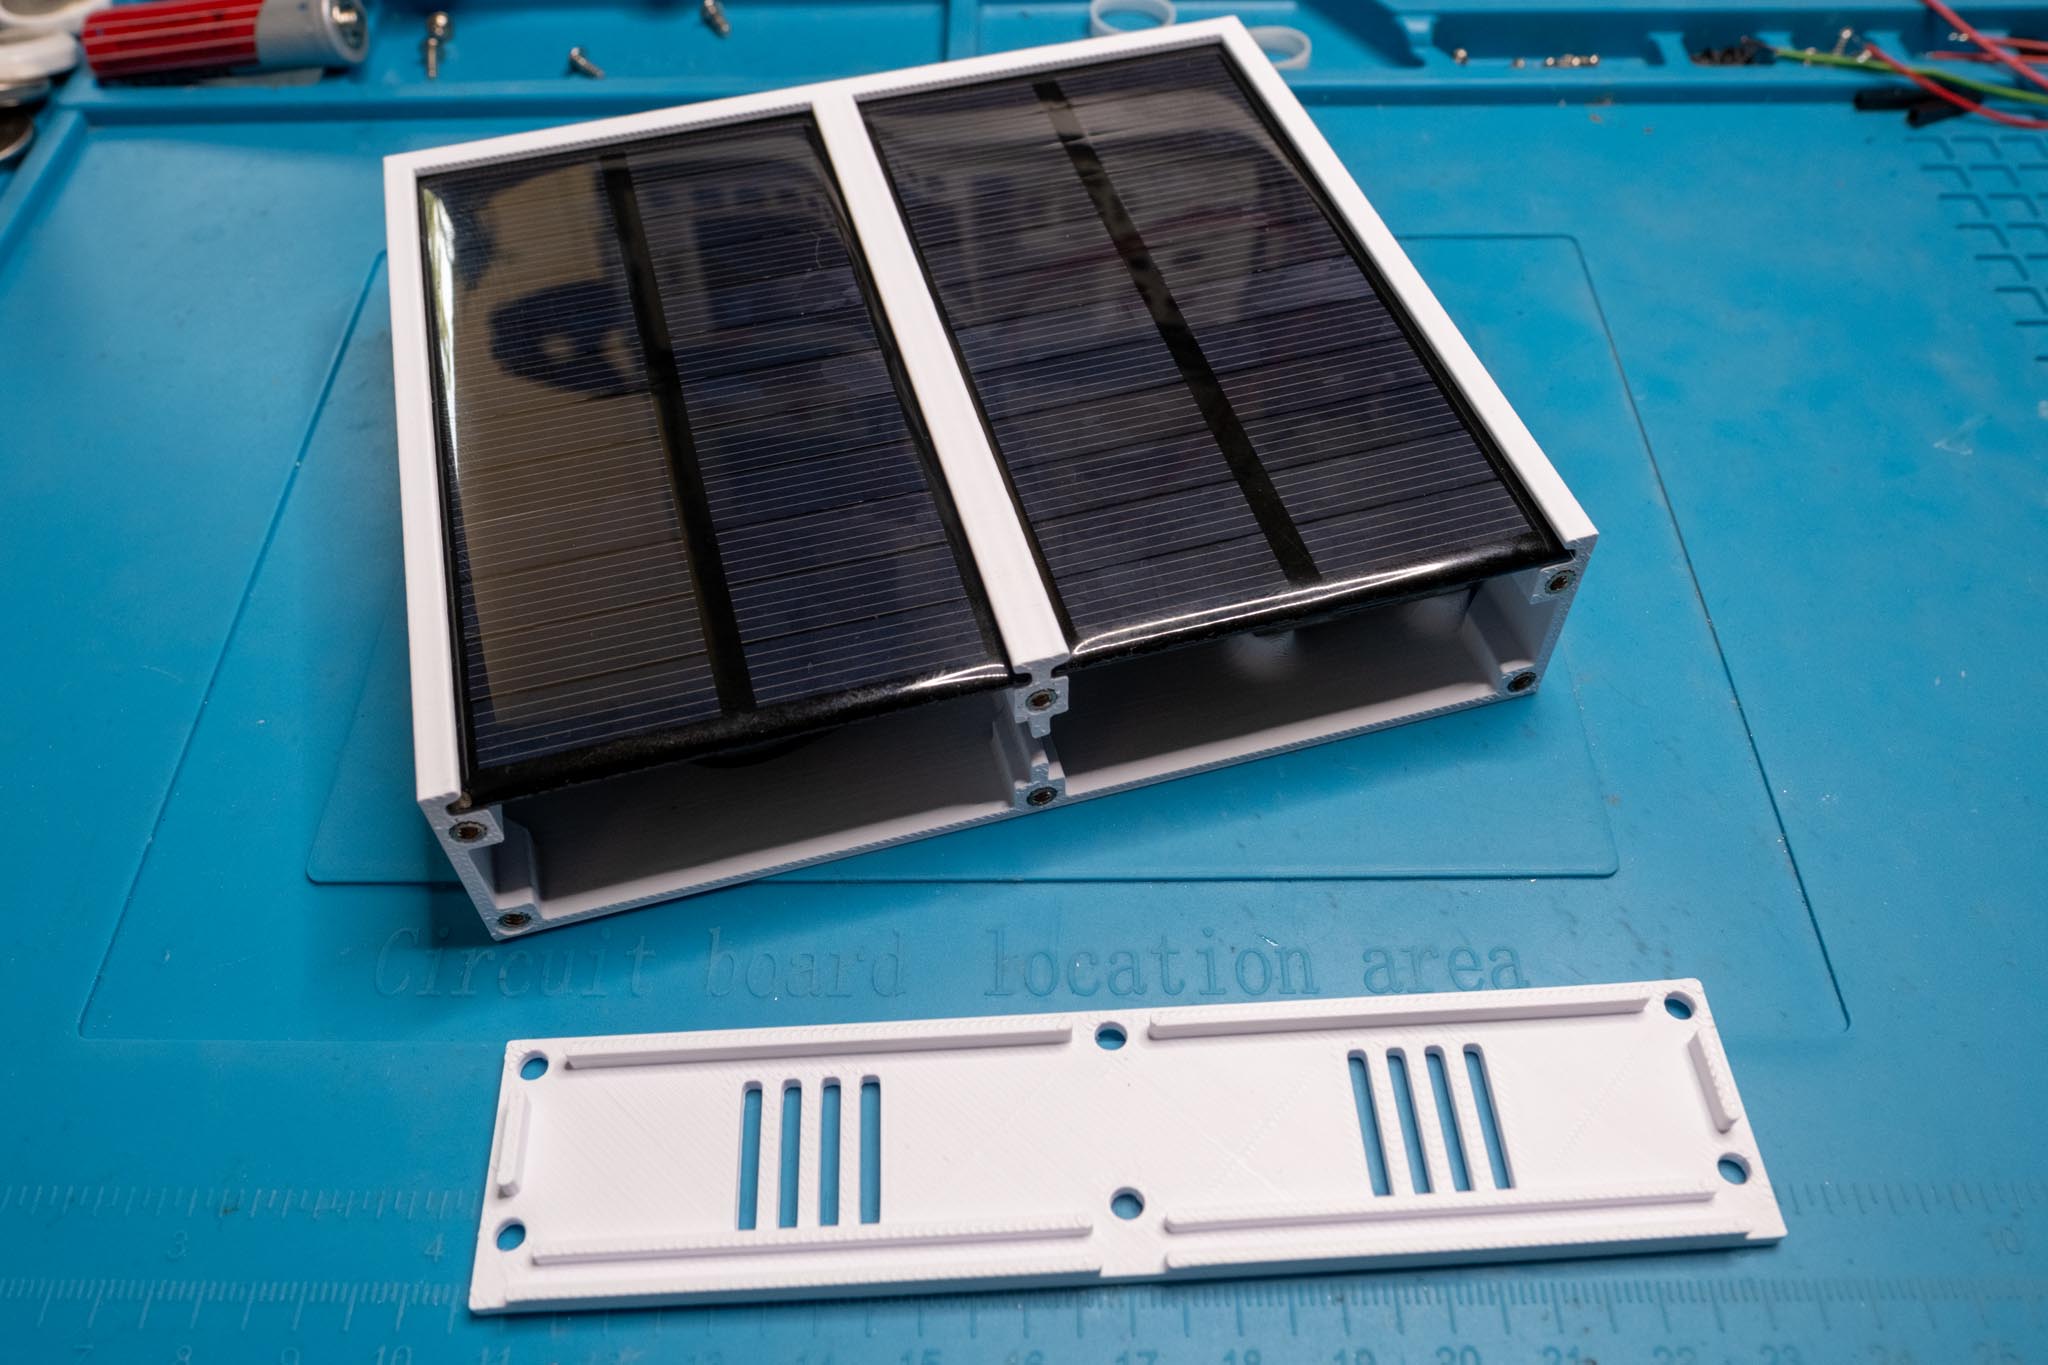
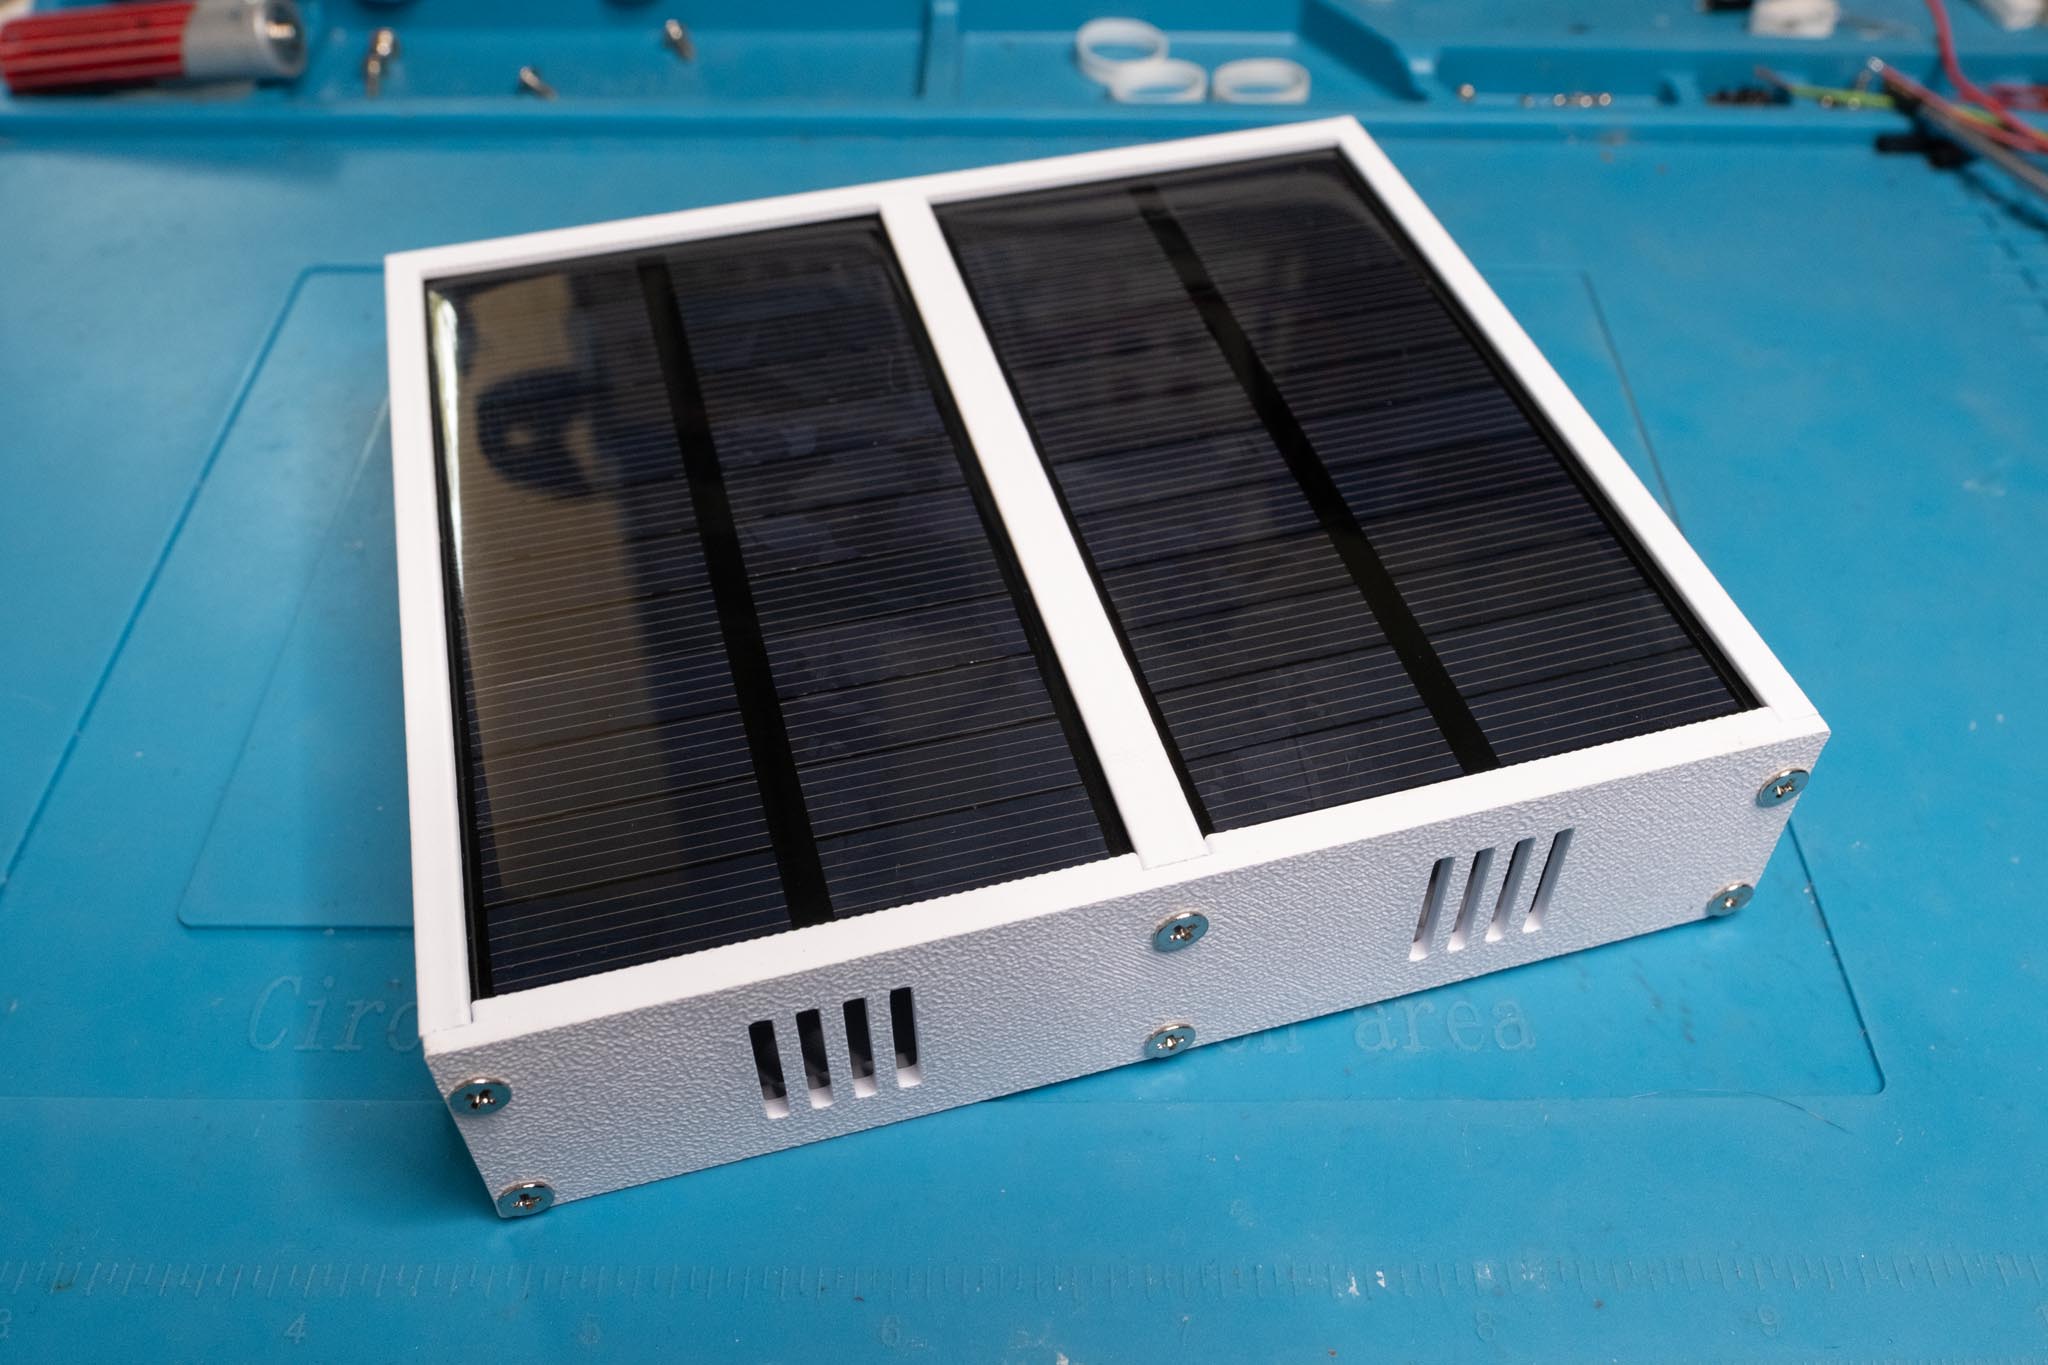
I also optimized the software a little further, in order to get the last bit out of the deep sleep mode as well. The power consumption now looks like this:
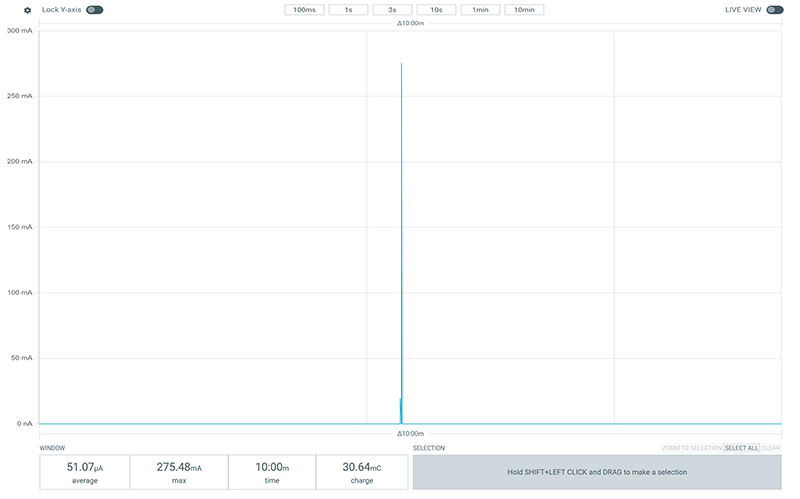
Compared to the old software I was thus able to reduce the average power consumption from approx. 80 to 51 µA. With a 2000 mAh battery that would mean 2000 mAh / 0.05107 mA = 39,162 hours, i.e. about 1632 days or almost 4½ years.
LoRa sensor with SHT45
For these sensors I use a Heltec WiFi LoRa 32 V3 board. Since this board has a display and a freely usable button, nothing has to be set via DIP switches anymore, but quite conveniently via a setup at the start of the sensor. On this enclosure, too, I again built in a small viewing window with the Snapmaker U1.
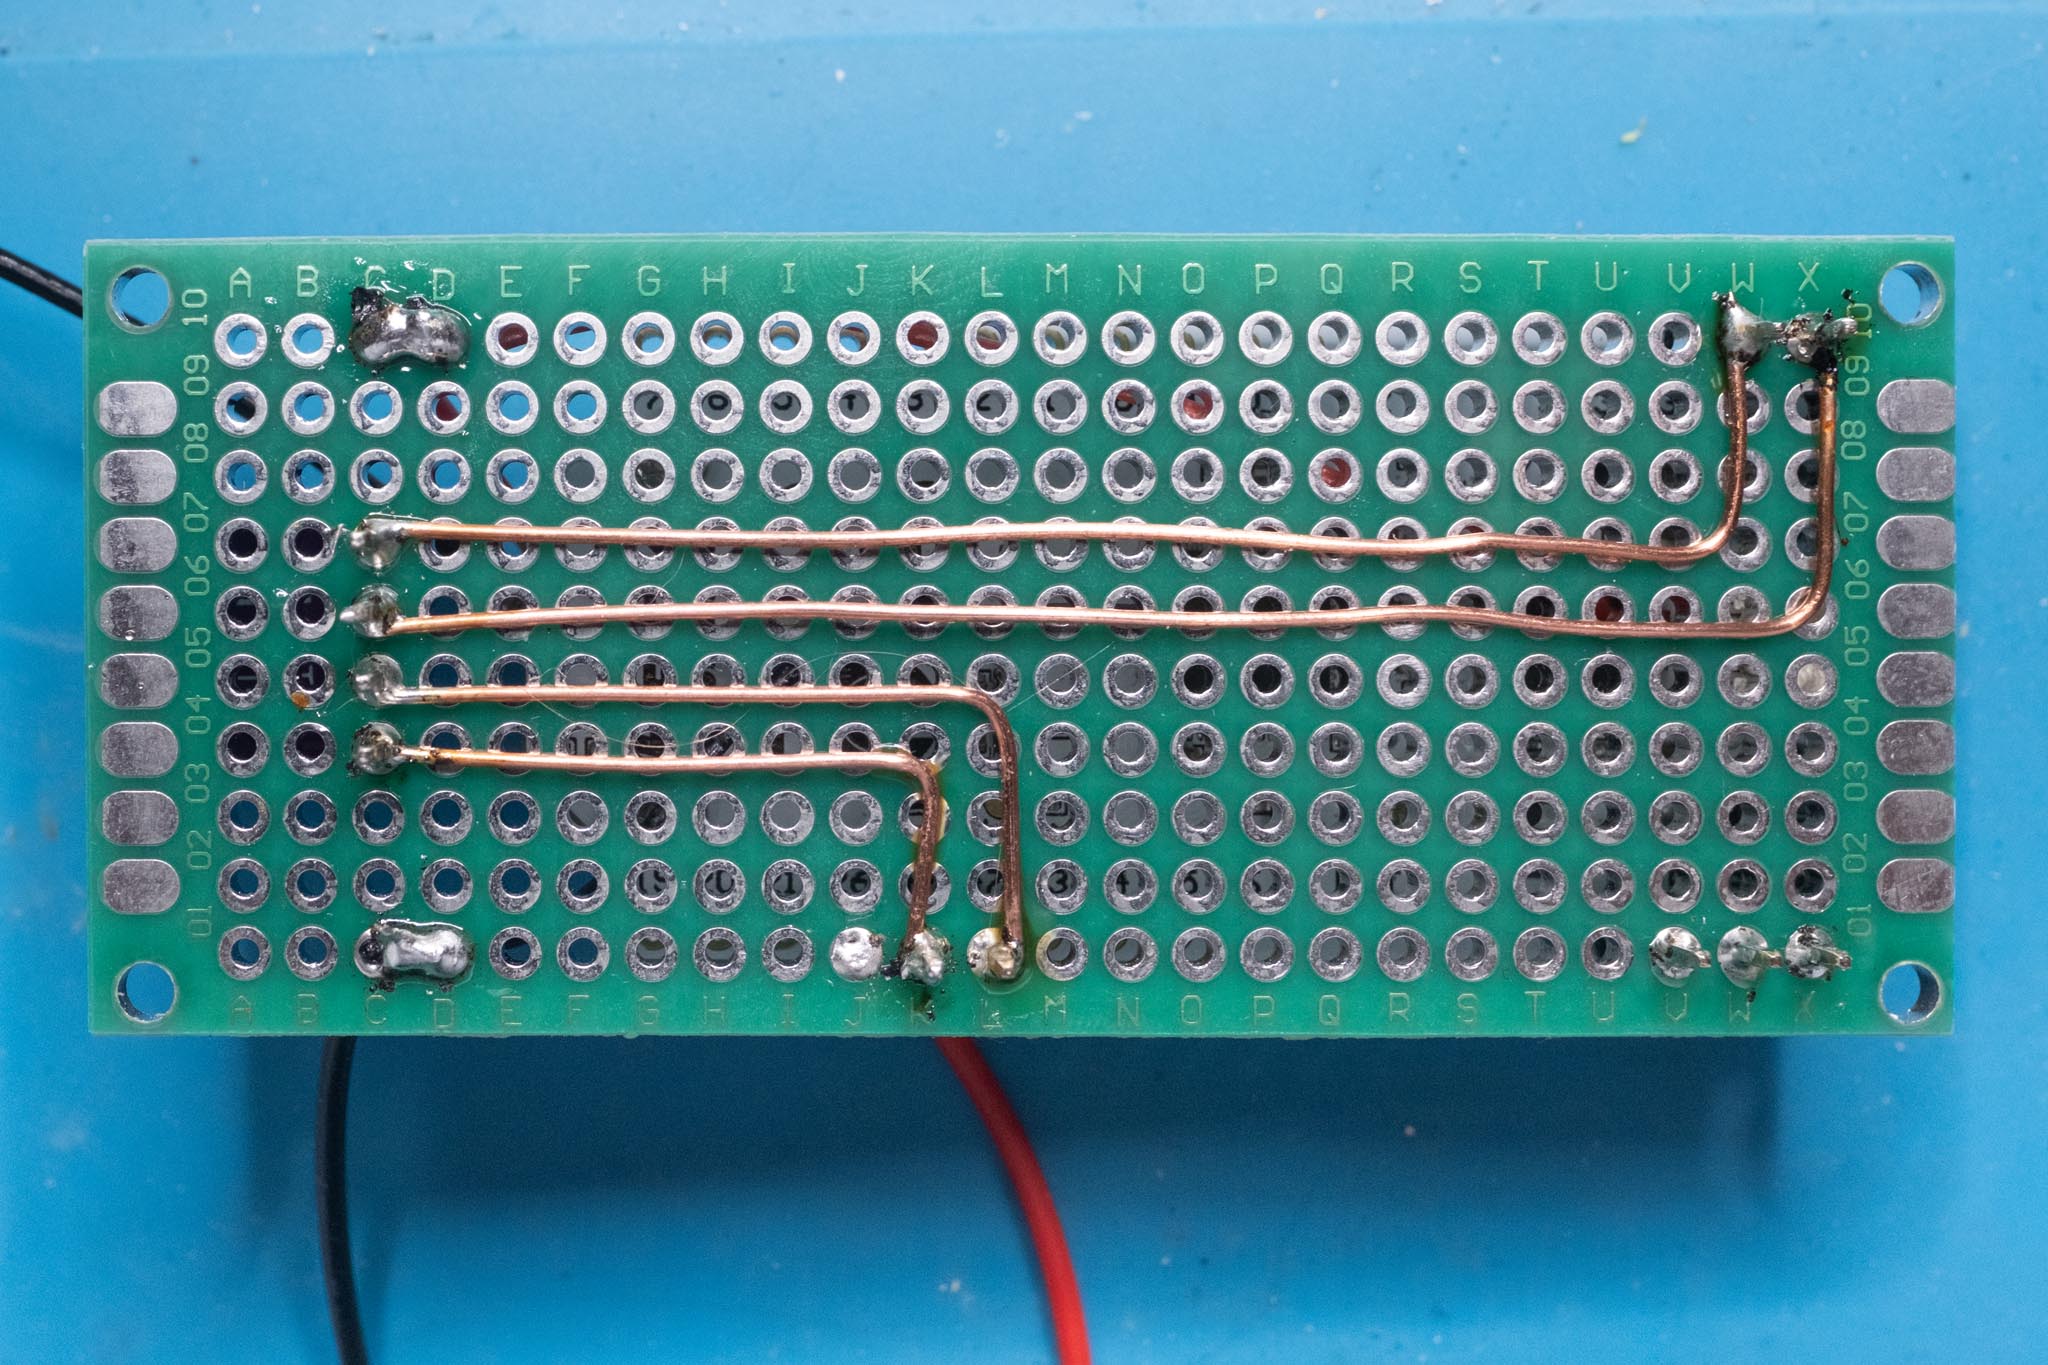
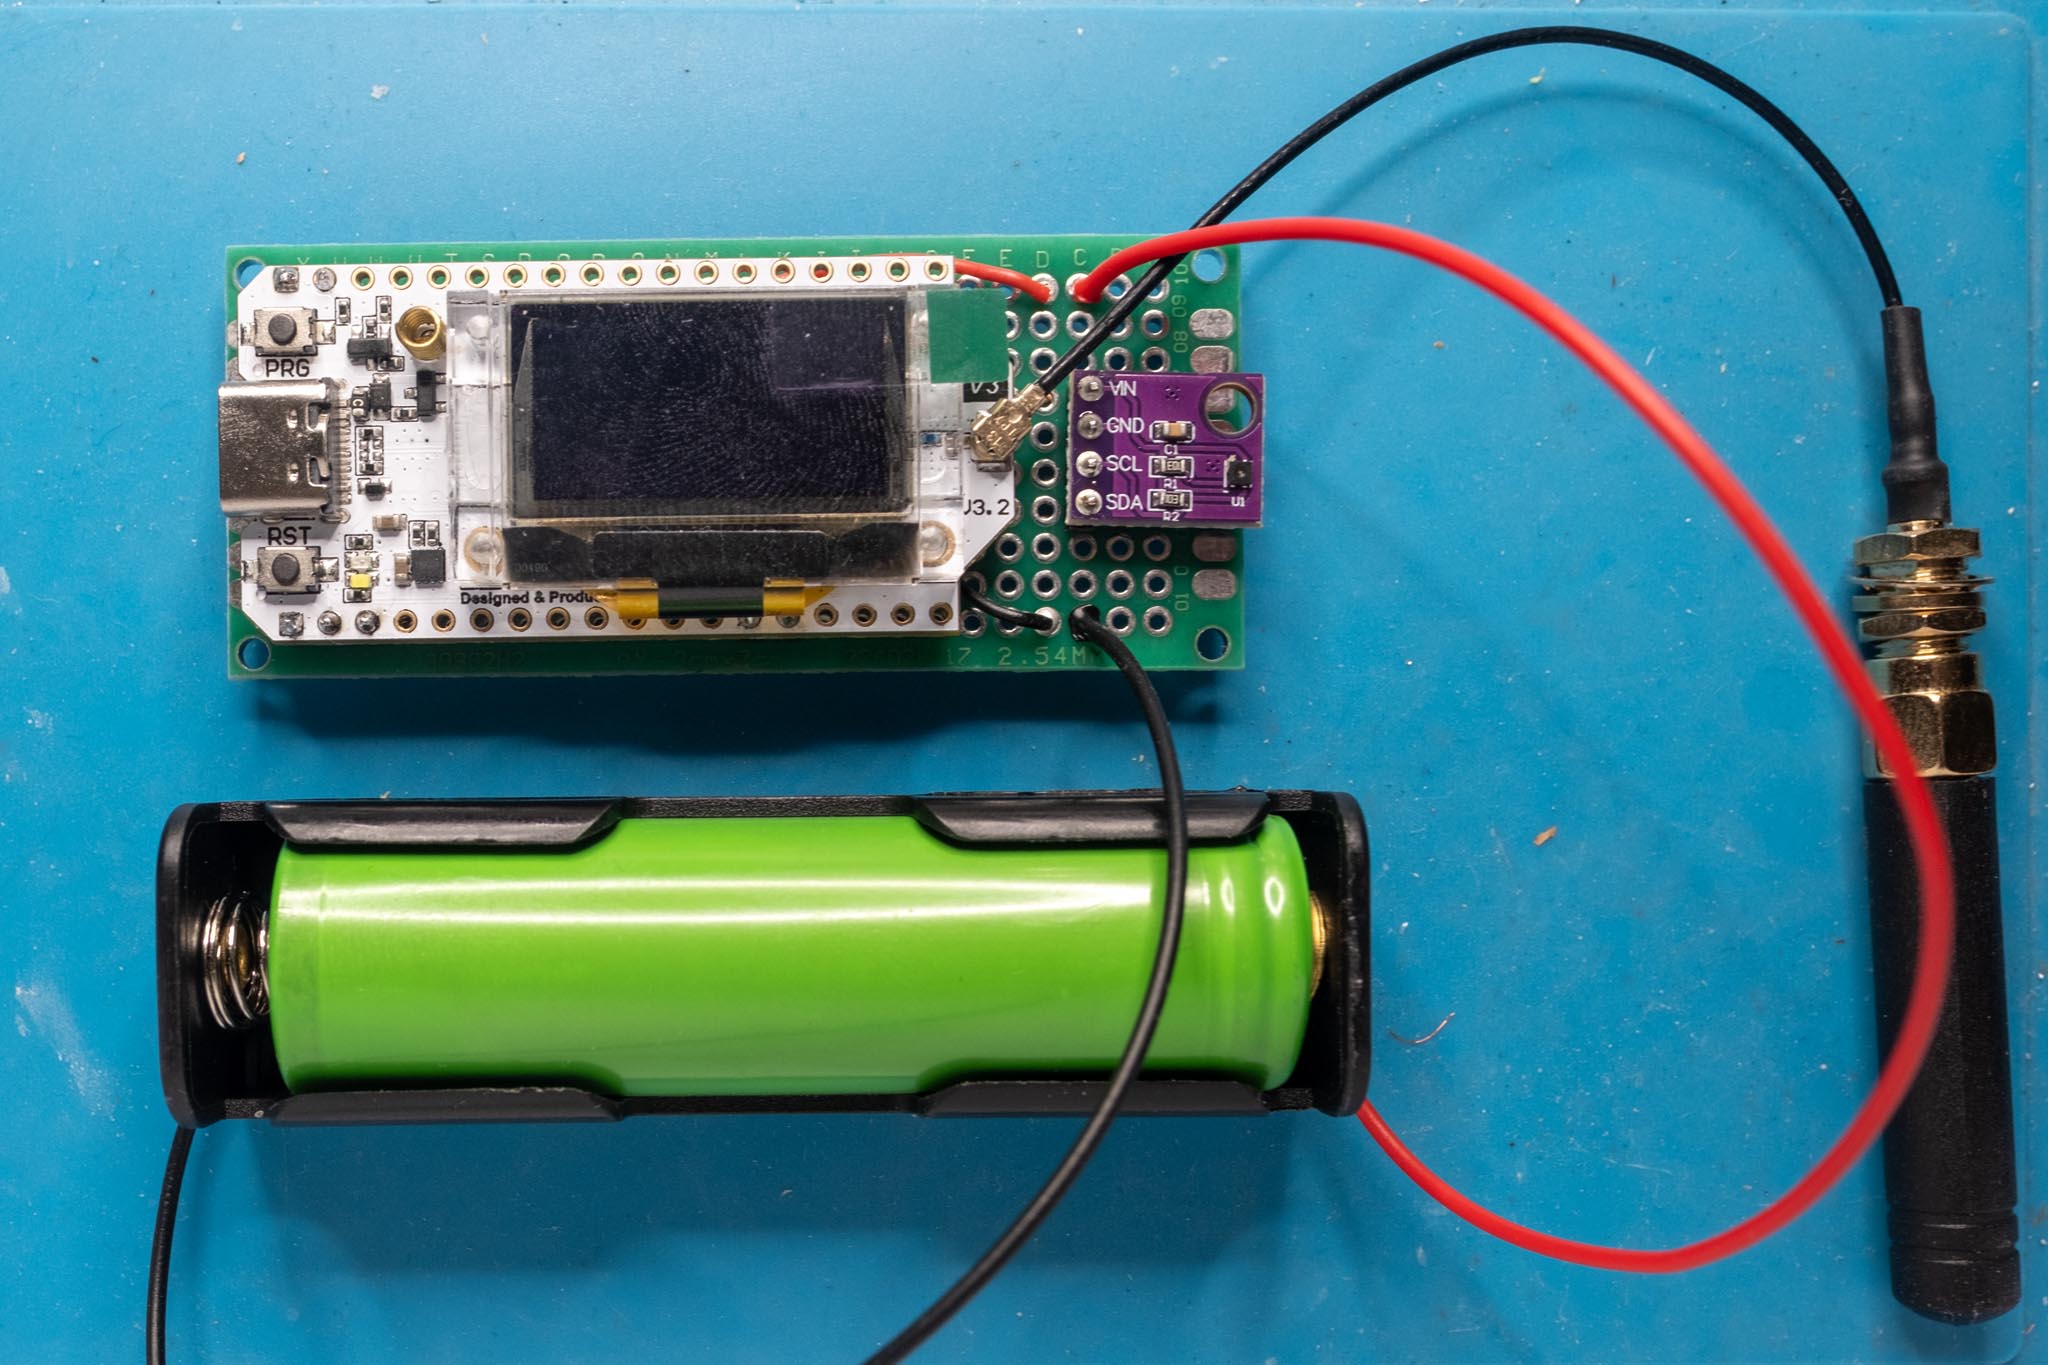
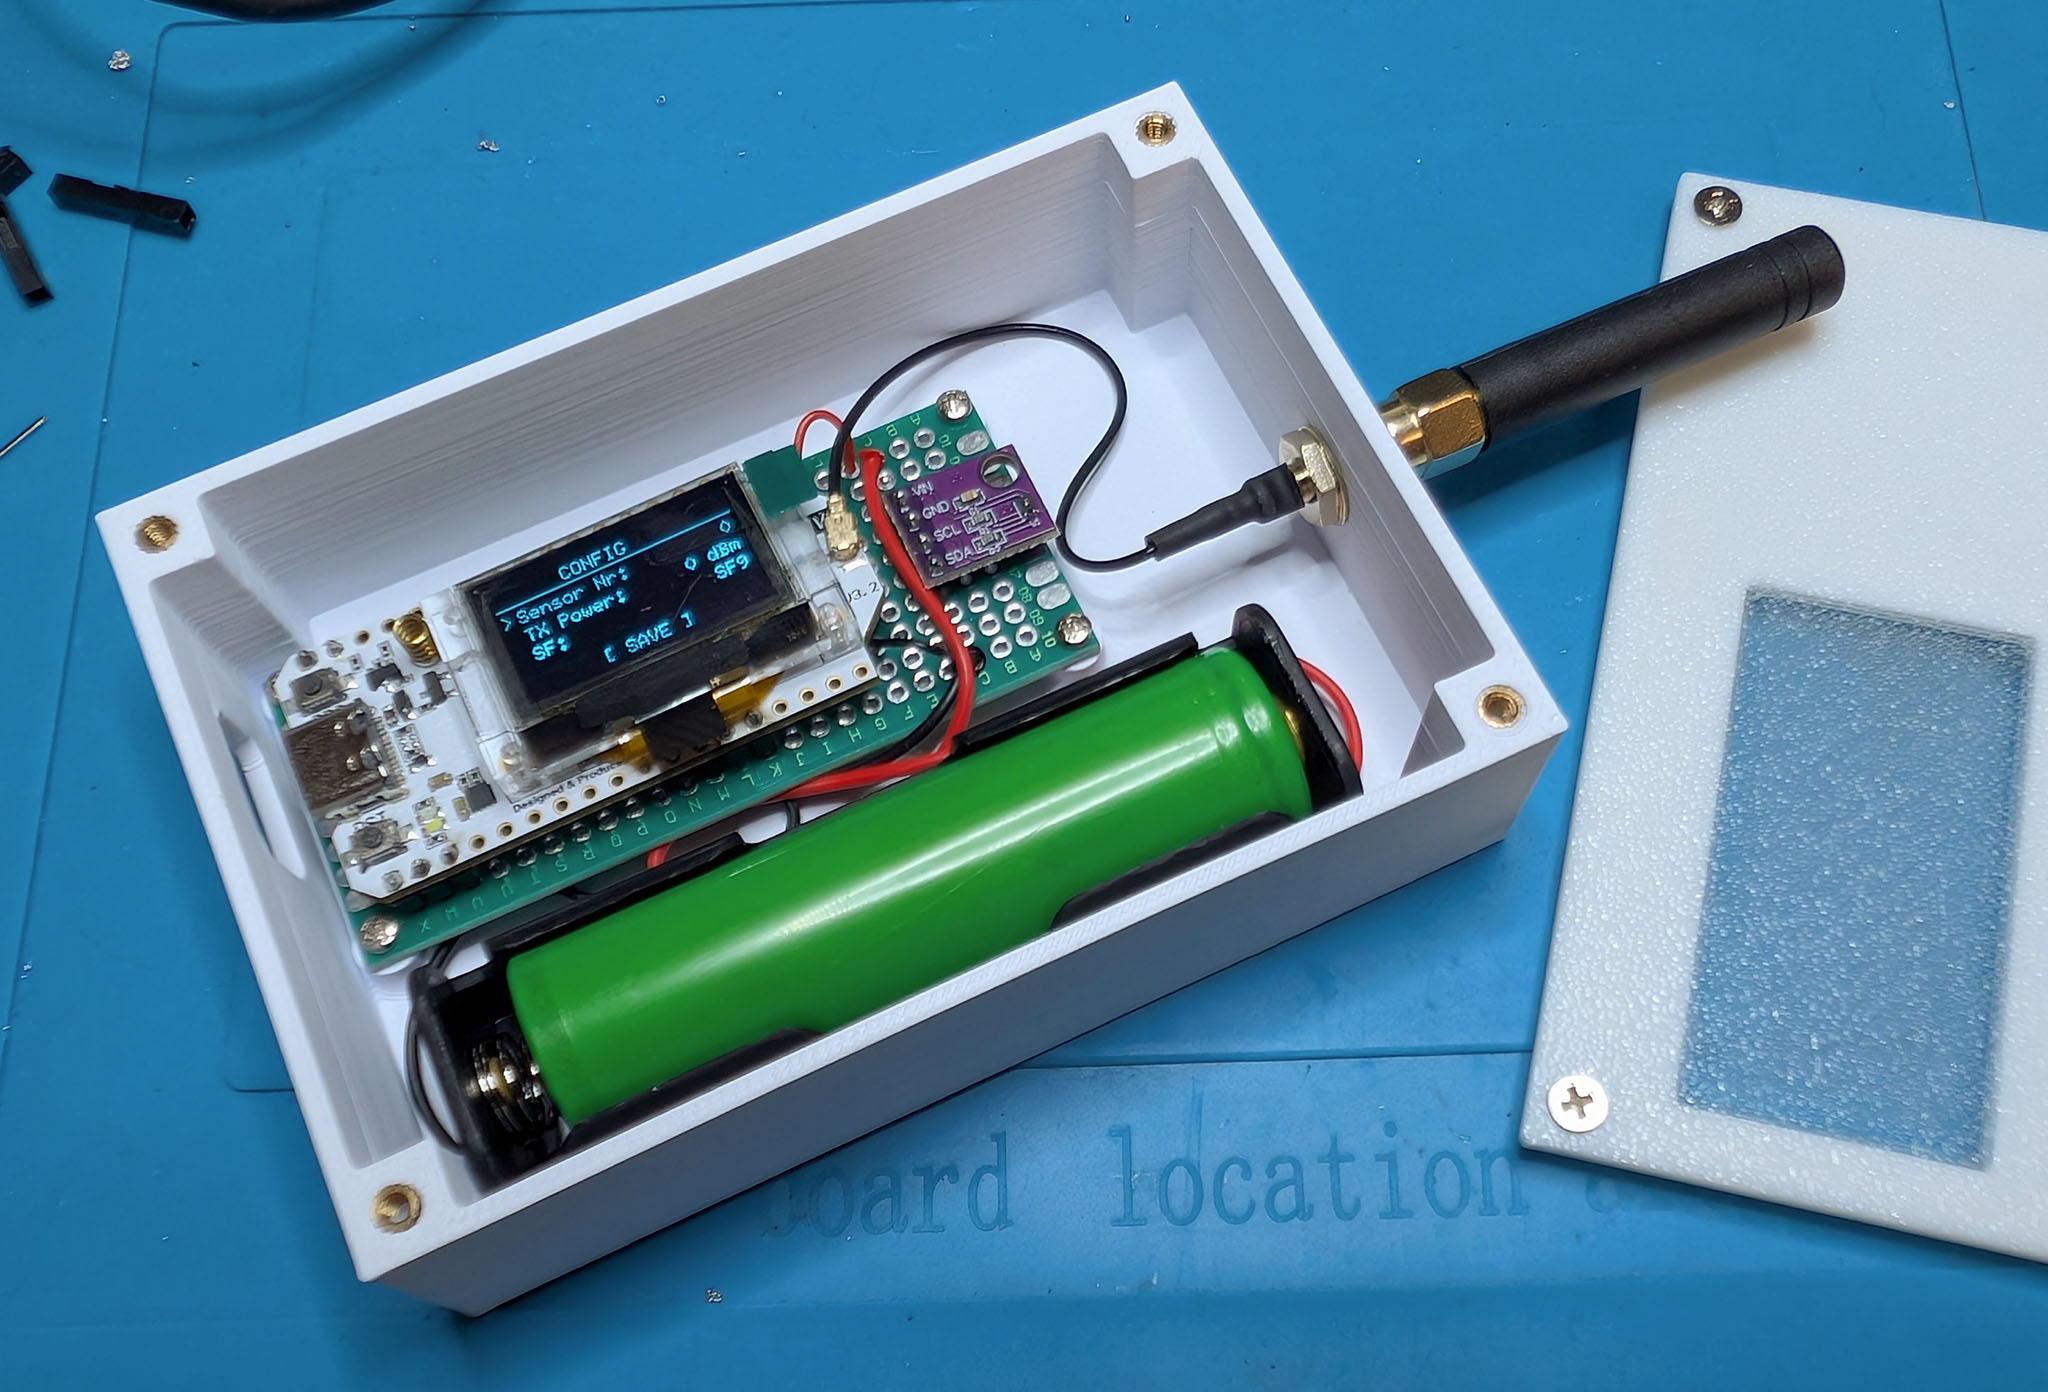
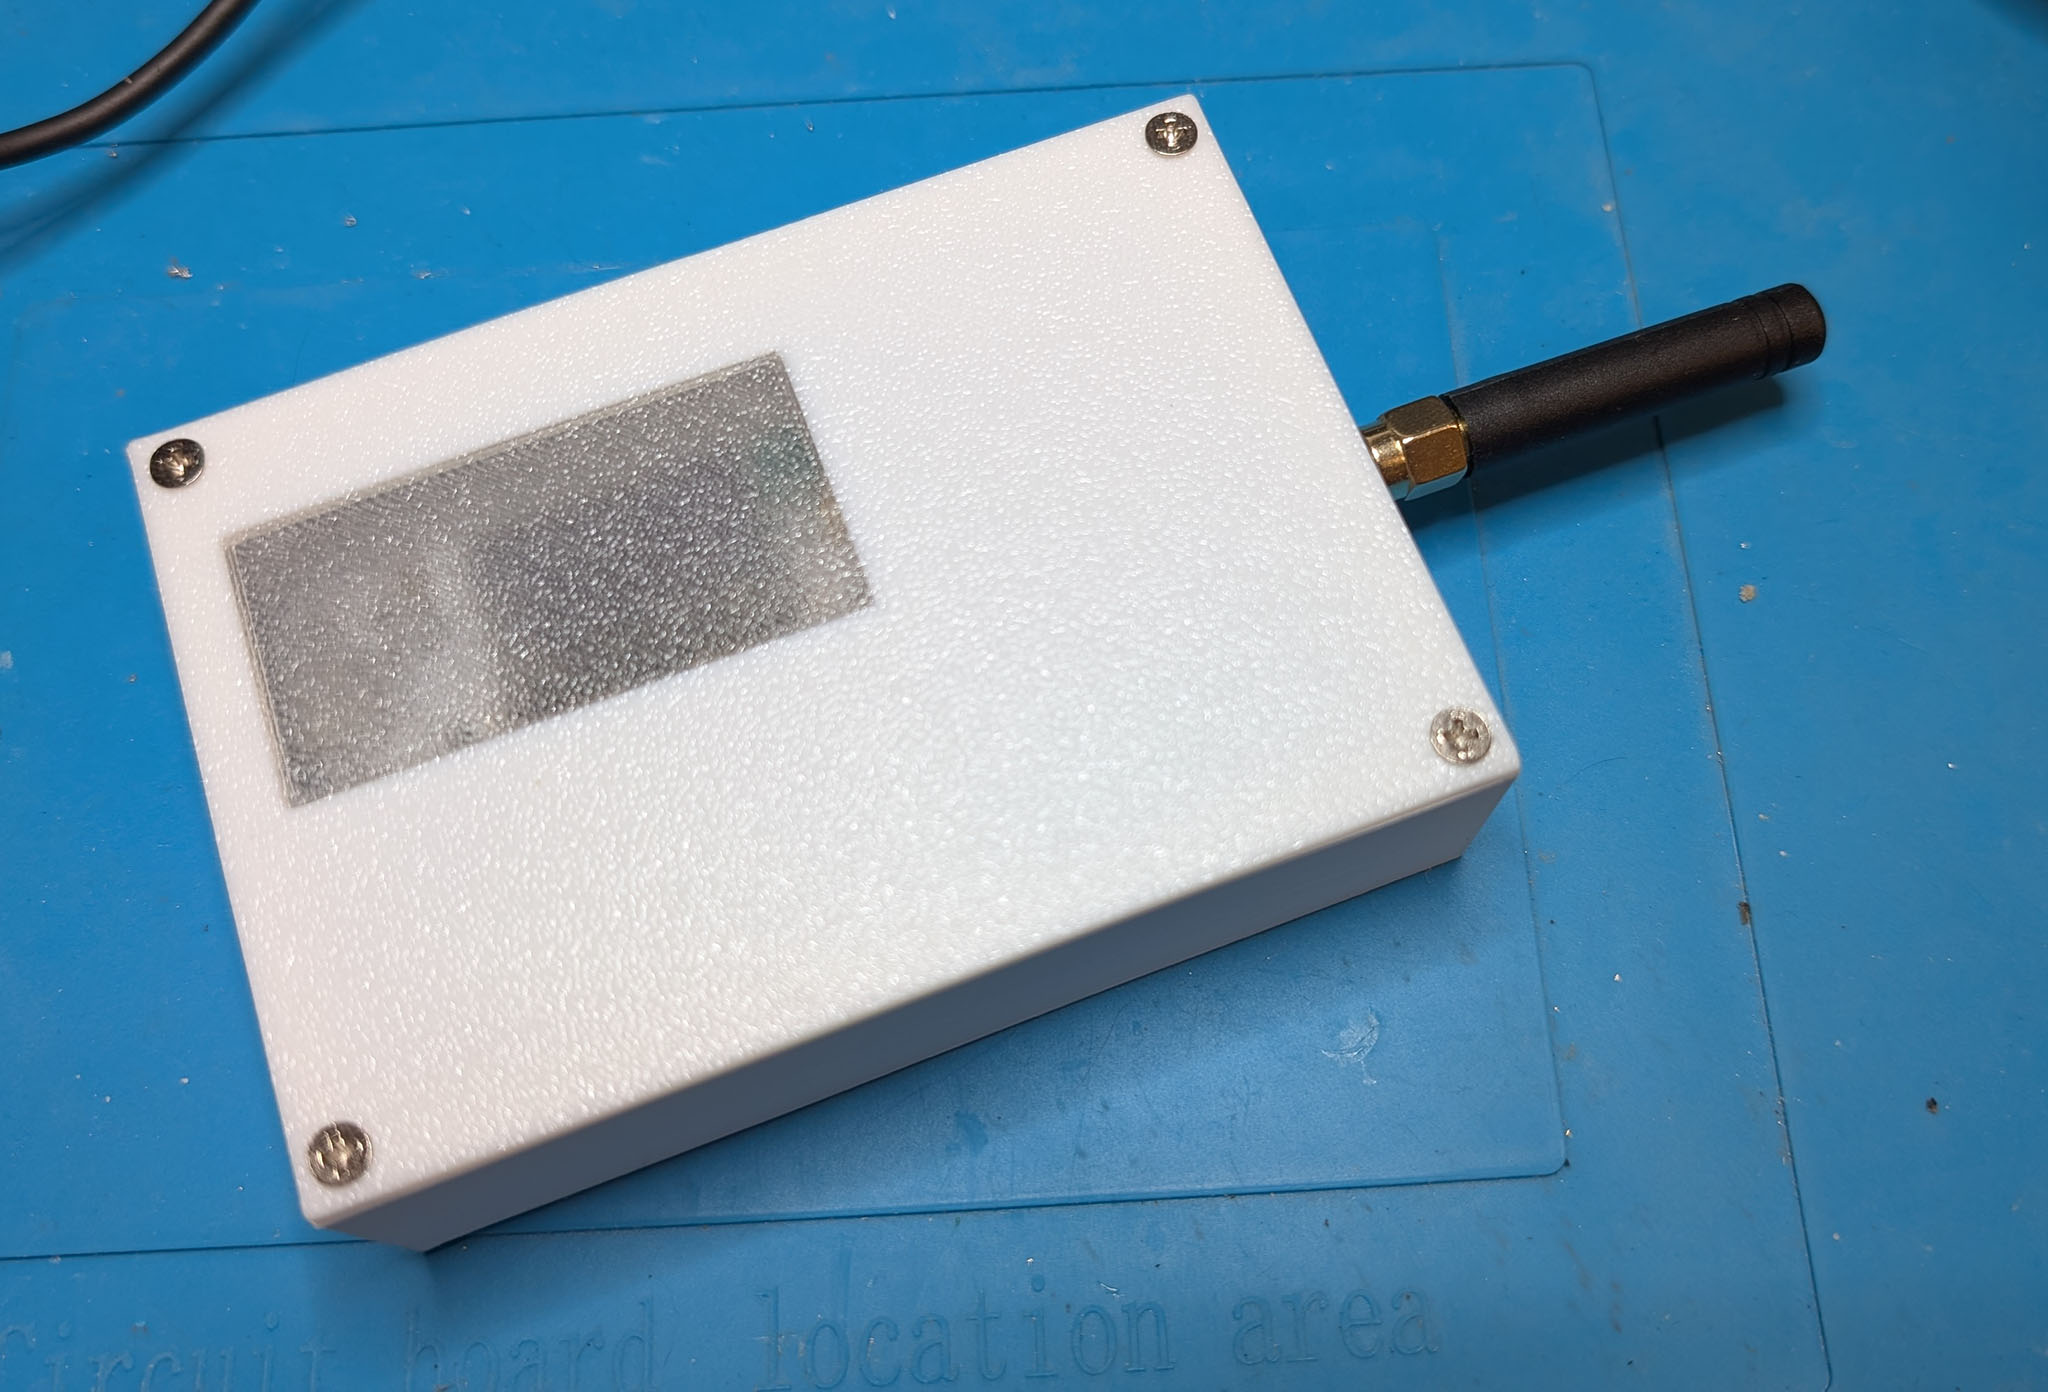
The Heltec WiFi LoRa 32 V3 board, in contrast to the V4 version, has no connector for solar cells. But if you look at the power consumption, that is not necessary at all.
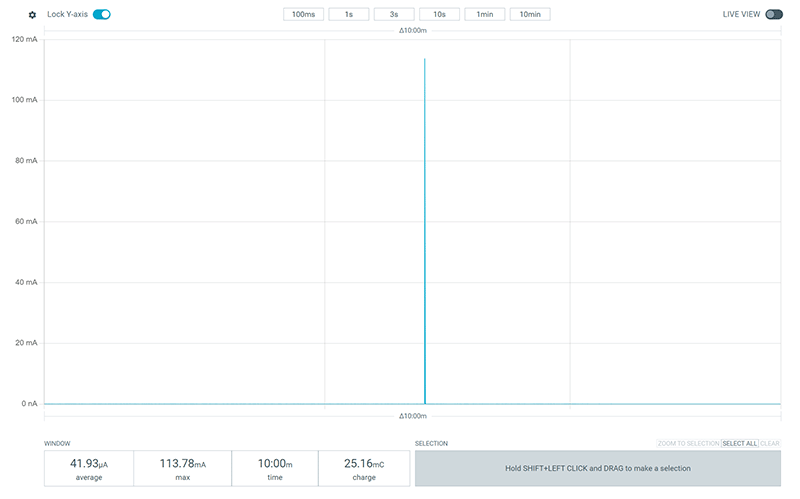
The time until the battery is discharged would here be 2000 mAh / 0.04193 mA = 47,699 hours, i.e. about 1987 days or almost 5½ years. I doubt that the weather station will even be in operation for that long. And of course the battery can be recharged via the USB connection.
LoRa sensor with RadiationD Geiger counter
Originally I built this sensor with a Heltec WiFi LoRa 32 V4 board, since here the charging via solar cells is absolutely necessary. But I need that board for something else in the meantime, which is why I switched to a cheaper Heltec HTCC-AB01 V2 board. This board is based on an ARM Cortex M0+ core and also has an SX1262 integrated. However, the board has no display, which is why DIP switches are again necessary here to set the number of the sensor. The transmit power is in this case fixed in the code.
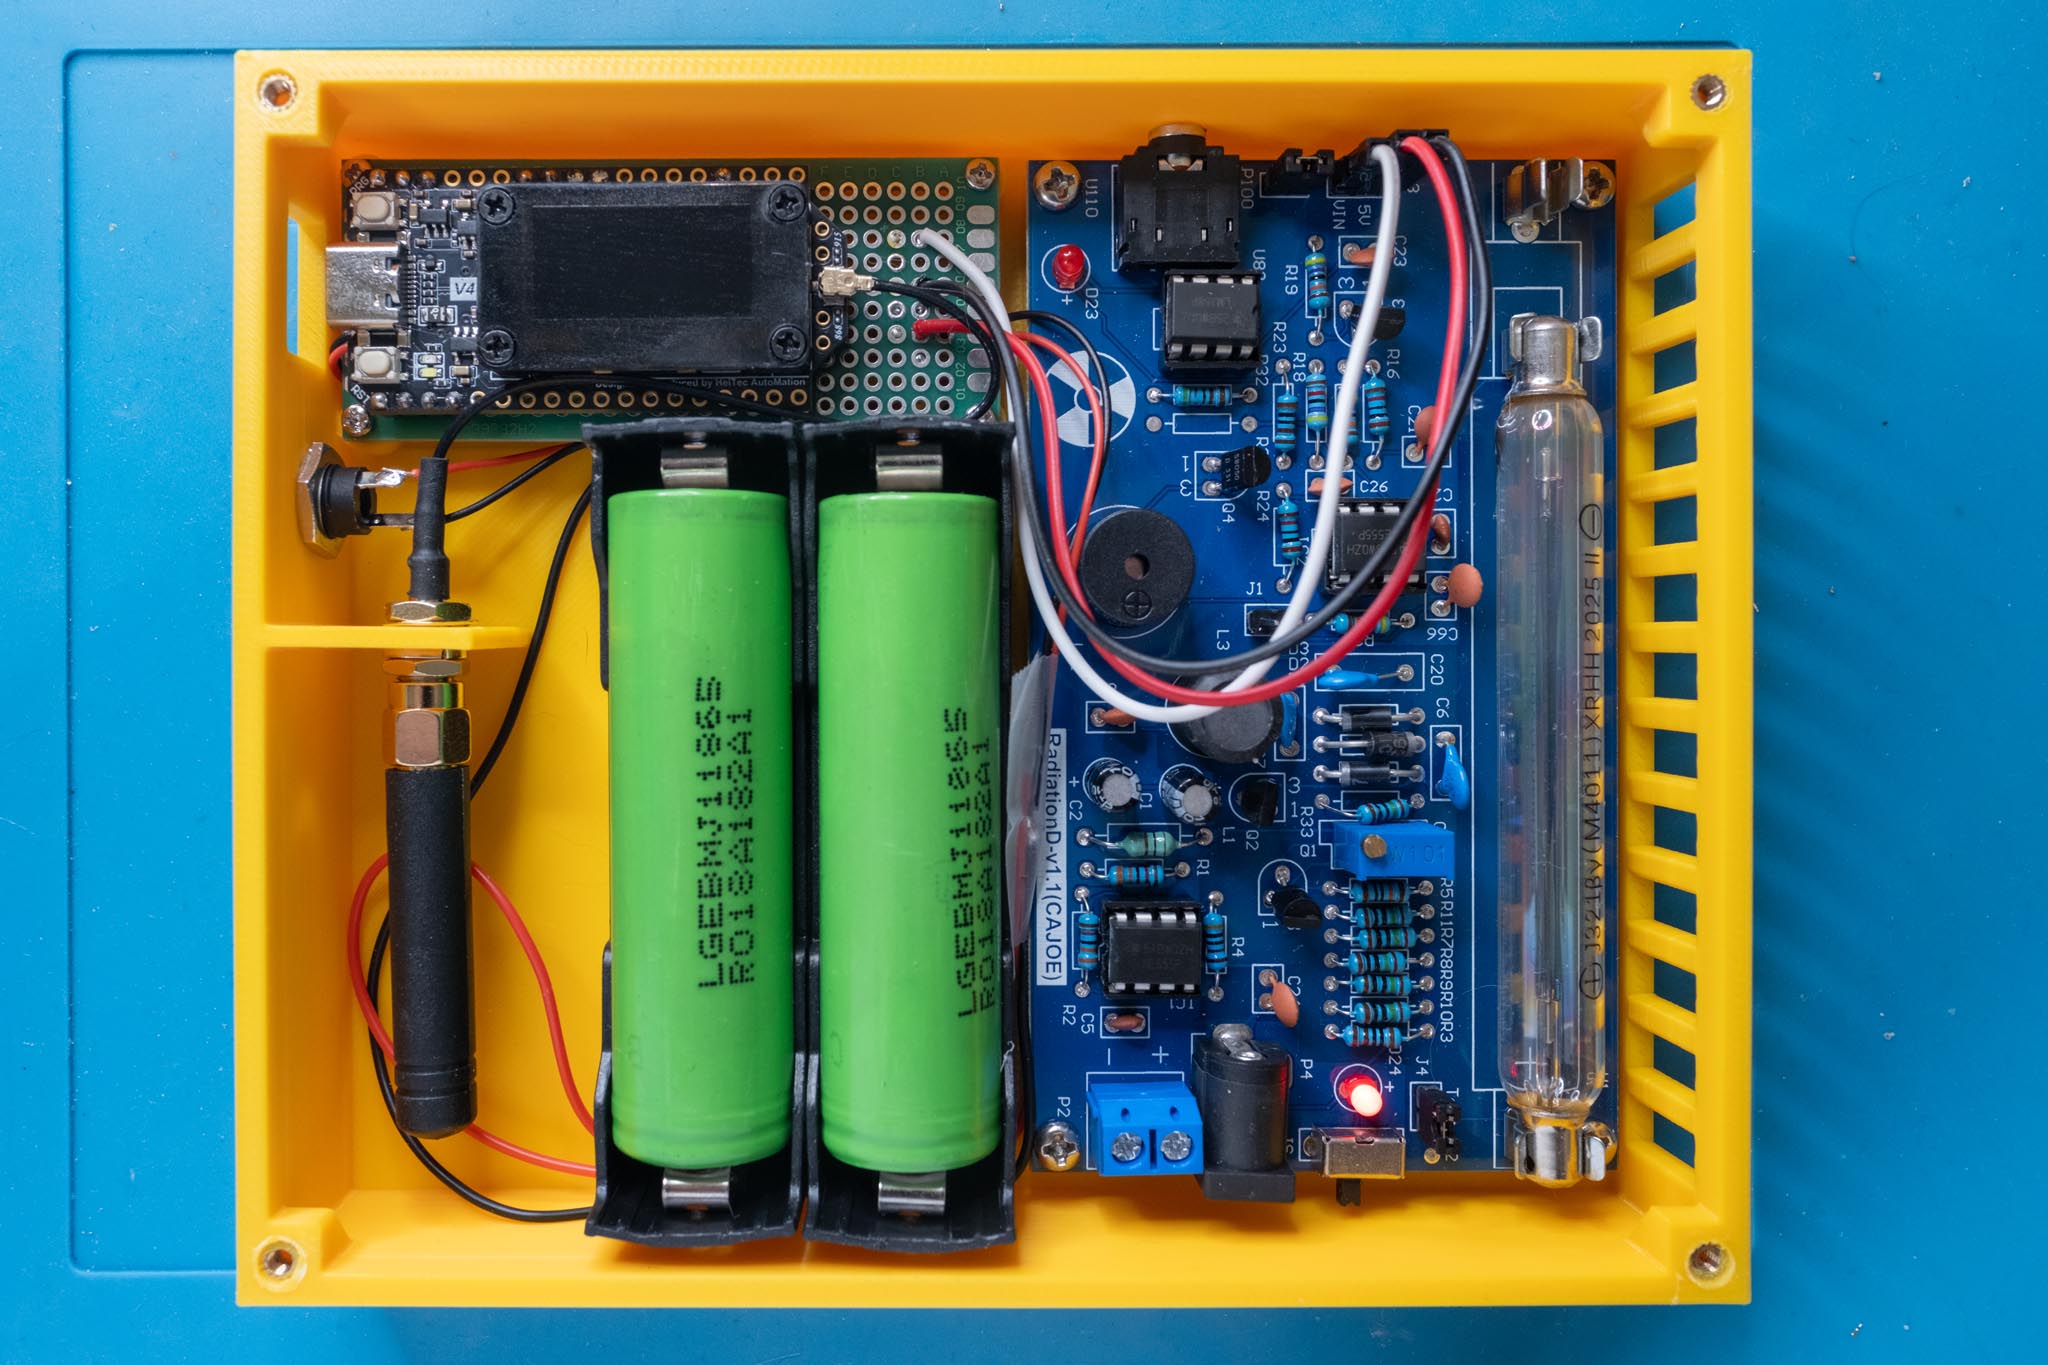
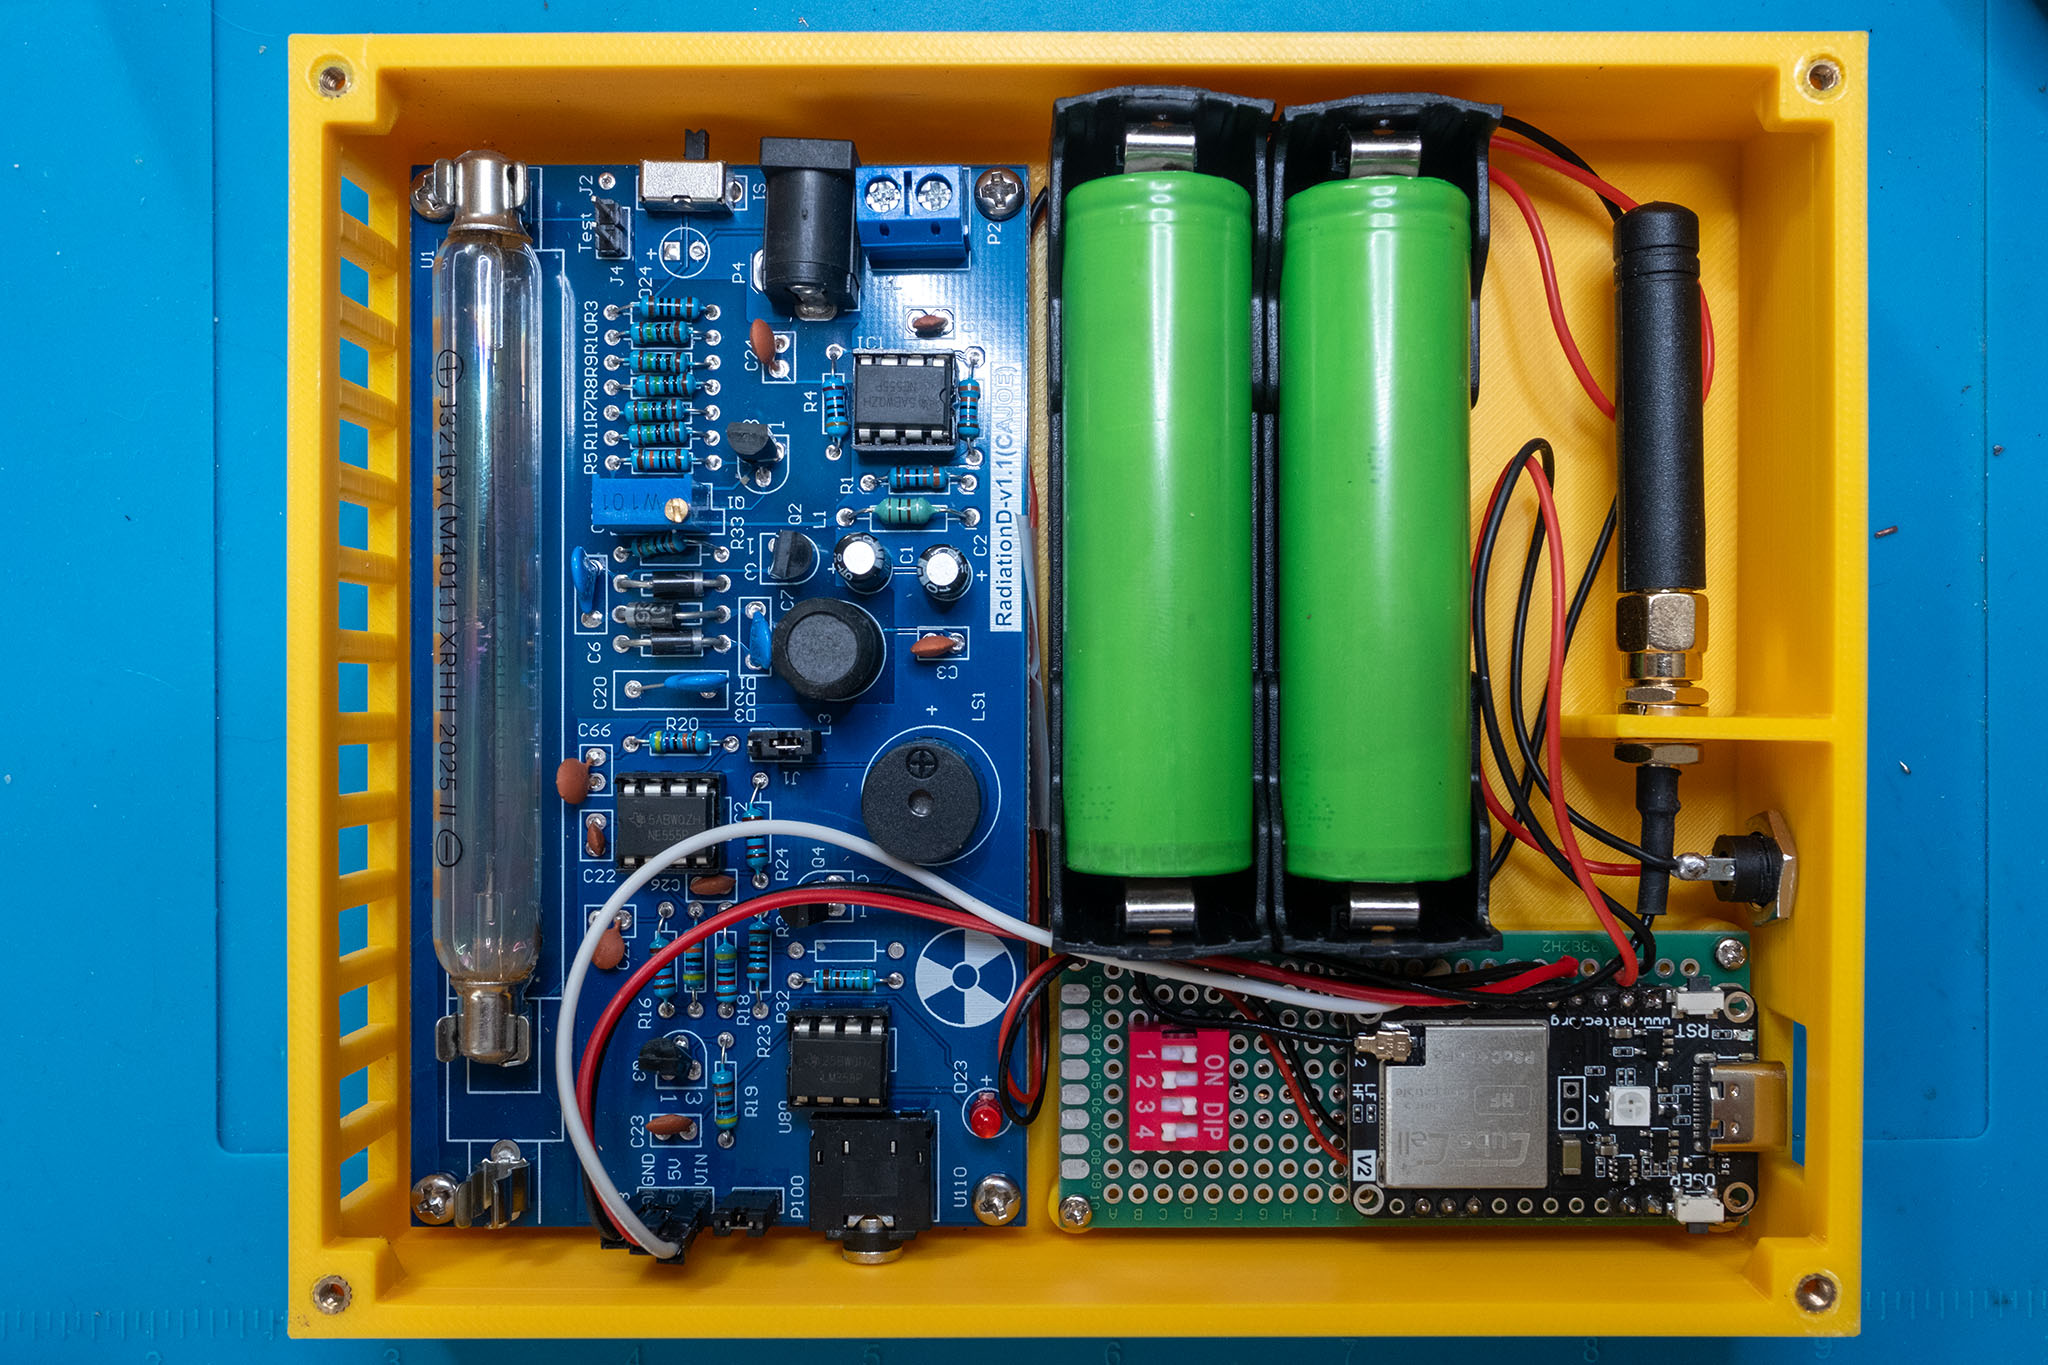
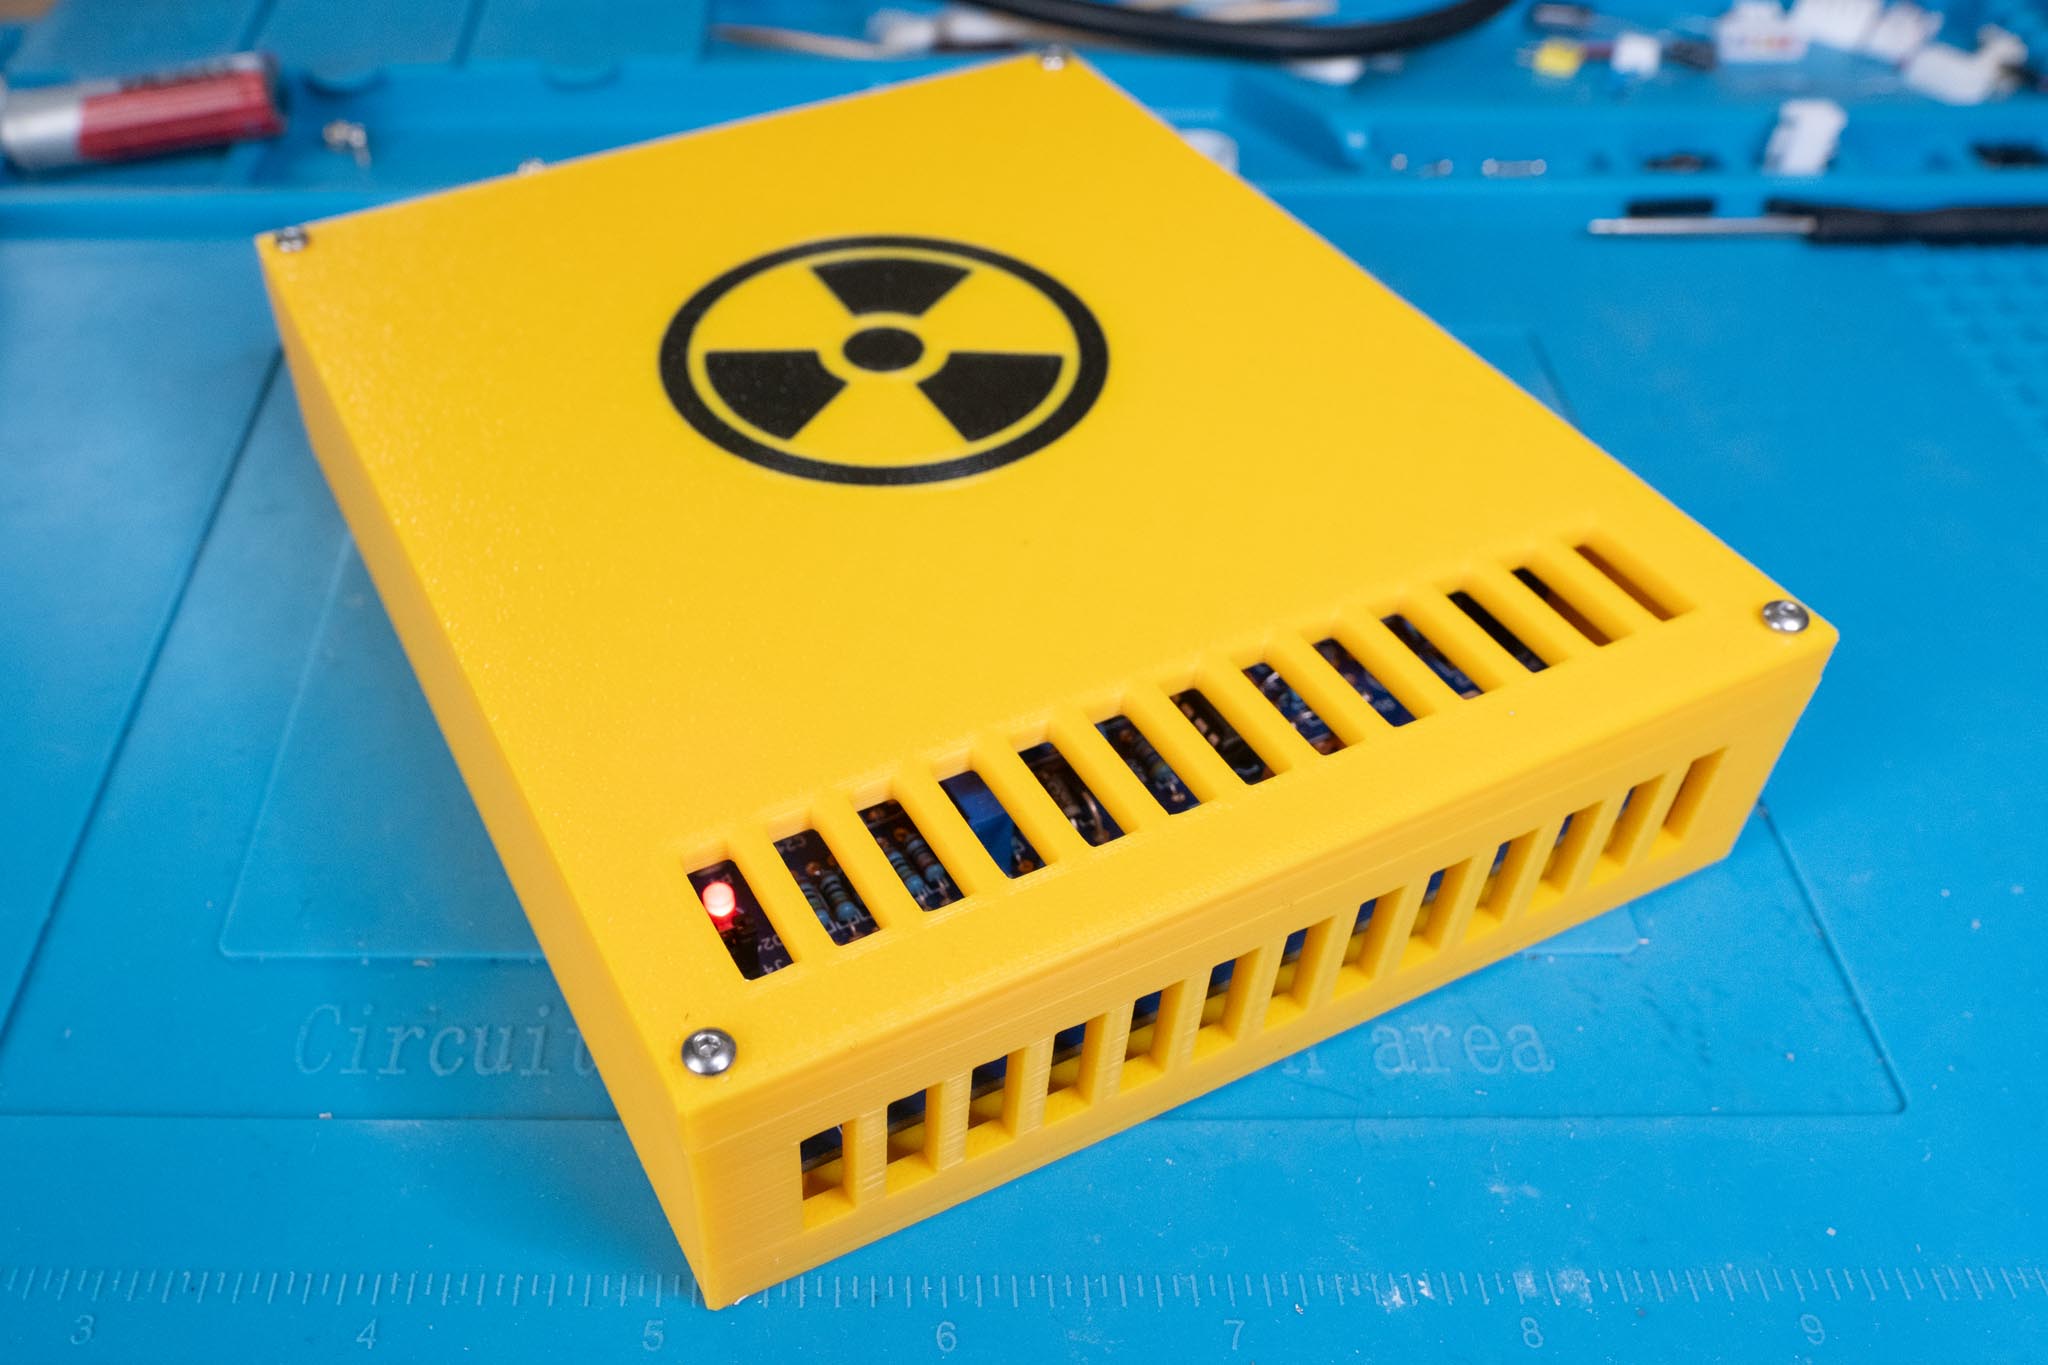
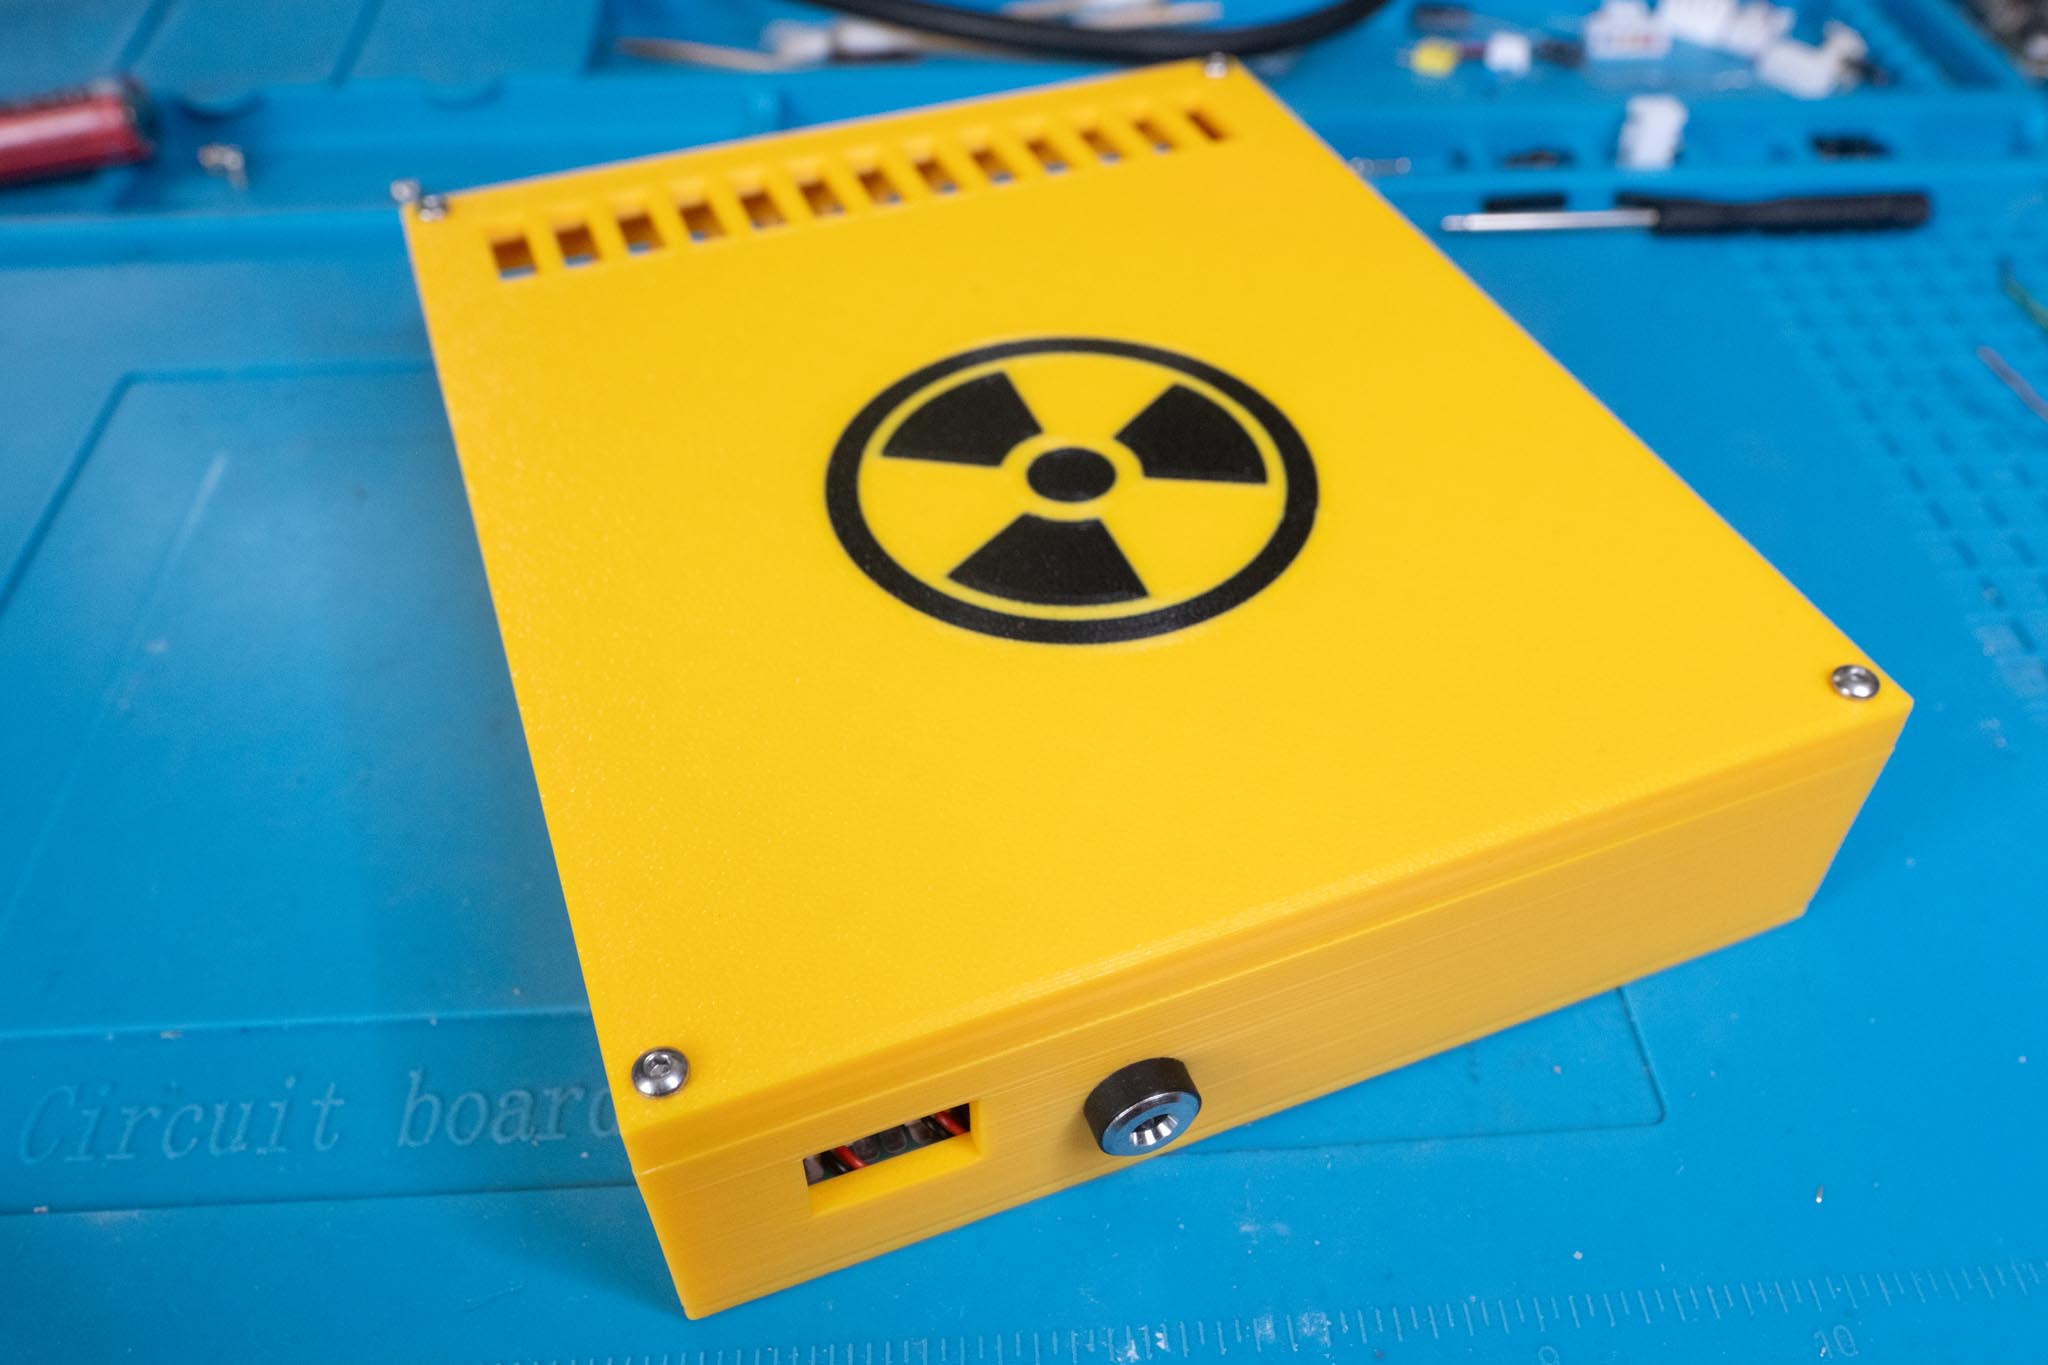
The challenge with both boards was the power consumption, since the pulses of the Geiger counter have to be counted permanently. The code for the ESP32 board is therefore based on an example from Espressif in which the Ultra Low Power (ULP) coprocessor is used for the counting. The HTCC-AB01 V2, on the other hand, allows waking up directly out of deep sleep via an edge-triggered GPIO interrupt, so that each pulse only wakes the CPU briefly. Between the pulses and the minute-by-minute LoRa transmissions, both the processor core and the radio module sleep.
The average power consumption is of course nevertheless very high, since the Geiger counter consumes relatively much power:
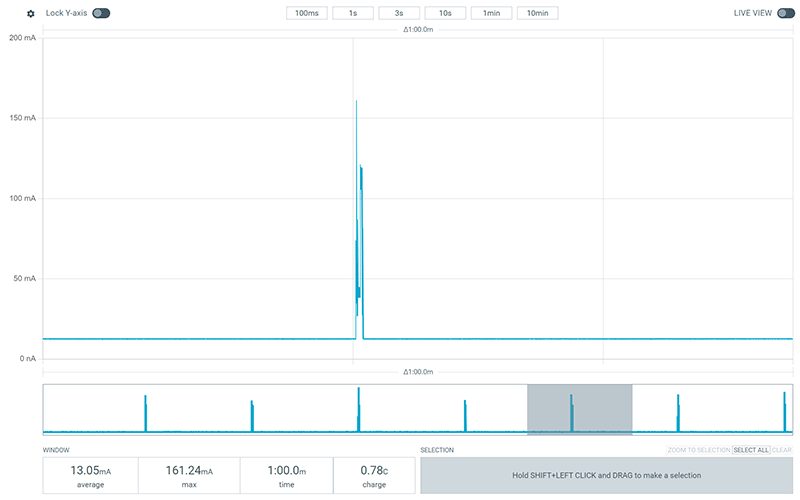
I later even desoldered the power LED from the Geiger counter in order to save a few mA. The radio module is powered with two 110 x 110 mm solar cells, and now in summer that is no problem. Whether it will also be enough in November, when the sun doesn't shine for weeks, remains to be seen.
What the ESP32 weather station costs
Finally I would like to briefly go into the total costs of the weather station. Since, as mentioned at the beginning, I only used high-quality components, the material costs are considerably above what you pay for the usual standard weather stations with one outdoor sensor.
The base station essentially consists of these components:
- Waveshare ESP32-P4-Module-DEV-KIT-C board: directly from Waveshare €67.20, on Amazon €109.91
- Heltec V4: on Amazon €29.12
- Sensirion SEN66: available at SOS electronic €50.52
- Light sensor BH1750: on Amazon €6.54 (3 pieces)
- C4001 24GHz (12 meters): at BerryBase for €12.90
That comes to a total of approx. 160 euros.
For the sensors the costs depend on the type used. The self-designed sensor board with the BME280 cost about 200 euros plus customs fees for 10 pieces. So very roughly 25 euros per sensor.
For the LoRa variant you have these costs:
- Heltec V3: on Amazon €23.18
- Sensirion SHT45: on Amazon €50.42 (5 pieces)
- Bosch BME280: on Amazon €15.72 (3 pieces)
- Li-Ion battery type 18650: on Amazon €16.13 (2 pieces)
- Battery holder: on Amazon €5.44 (6 pieces)
For the variant with the SHT45 this comes to over 40 euros per sensor.
On top of that come parts such as solar cells (on Amazon €15.52 for 3 pieces), PLA filament and other small parts such as connectors, screws or heat-set inserts.
Of course you can also order most of the parts from AliExpress. This does lower the costs a little, but it takes considerably longer until you get the parts.
Conclusion
The development of the new weather station stretched over several months. It is not so easy to determine when such a project is really finished. There is always some detail that can still be improved, or the next idea is already waiting for its implementation. What bothers me, for example, is that the Geiger counter uses up a whole sensor slot. I'm actually not interested in the value at all, and it will hopefully never change either. A pure alarm function would be completely sufficient. Then you could also integrate a carbon monoxide sensor with an alarm, although I'm not sure whether that is a good idea. With a potentially deadly gas, one should probably stick to professional devices. But I like the idea of alarms, I just need to think up a coherent concept.
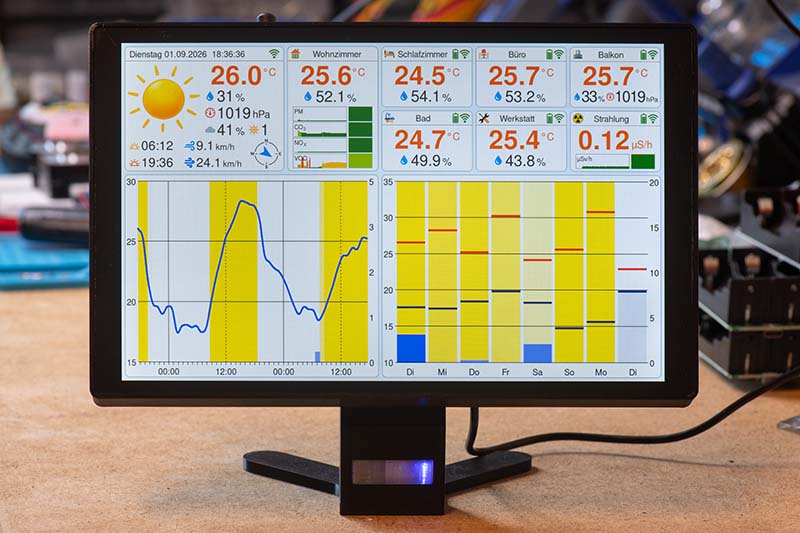
I will possibly rework the base once more as well. As already described above, without heat-set inserts and perhaps also a somewhat different shape. A tiltable screen would be a fine thing.
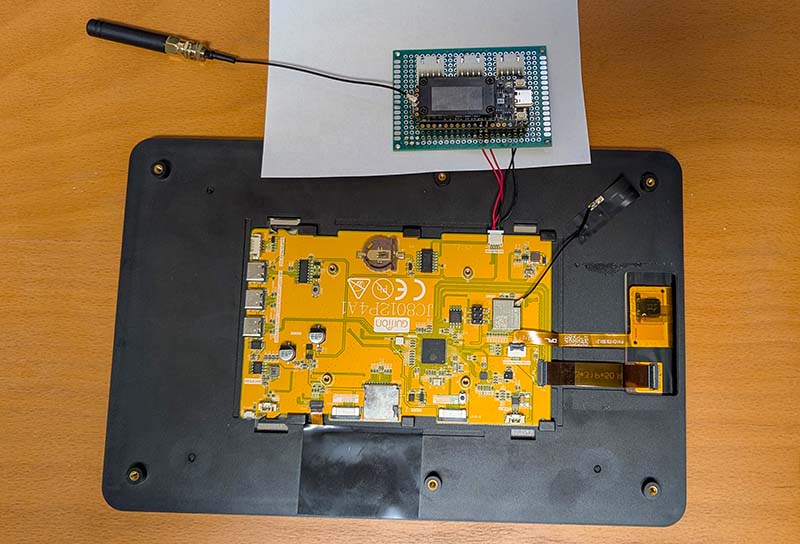
Furthermore I am already working on operating the weather station with other displays. In the photo you can see the Guition JC8012P4A1C_I_W_Y, which has the same size and resolution as the Waveshare display. There will, however, be a separate article about that.
If you have questions, you are as always welcome to get in touch with me. There are surely a few points that I did not explain well or even forgot. The entire code of the project is, as always, on GitHub. I would be very happy about new ideas or improvements.